- This article is inspired by the book Advances in Financial Machine Learning.
- This project’s Github Repository: https://github.com/Harkishan-99/Alternative-Bars
Bars (or candles) are the most common form of financial data consumed by finance practitioners. Now, when I say bars, most of you must be thinking about time bars (e.g. daily bars, hourly bars or minute bars). I must say they are quite popular but the concept of building/sampling time bars carry two major flaws -
/activetrading16-5bfc2b9ac9e77c005143f30a.jpg)
1) Markets are not chronological: While sampling time bars we assume that markets will process information at a constant time interval (say every hour, for hourly bars). That means we are assuming trades occur at a constant time interval (like every hour), which is not true. For example, we see a high volume during the market opening and closing hours and steady during the rest of the day for most assets. Also, the trade activity increase near earnings call or similar market events. These events cannot be captured by simple time bars.
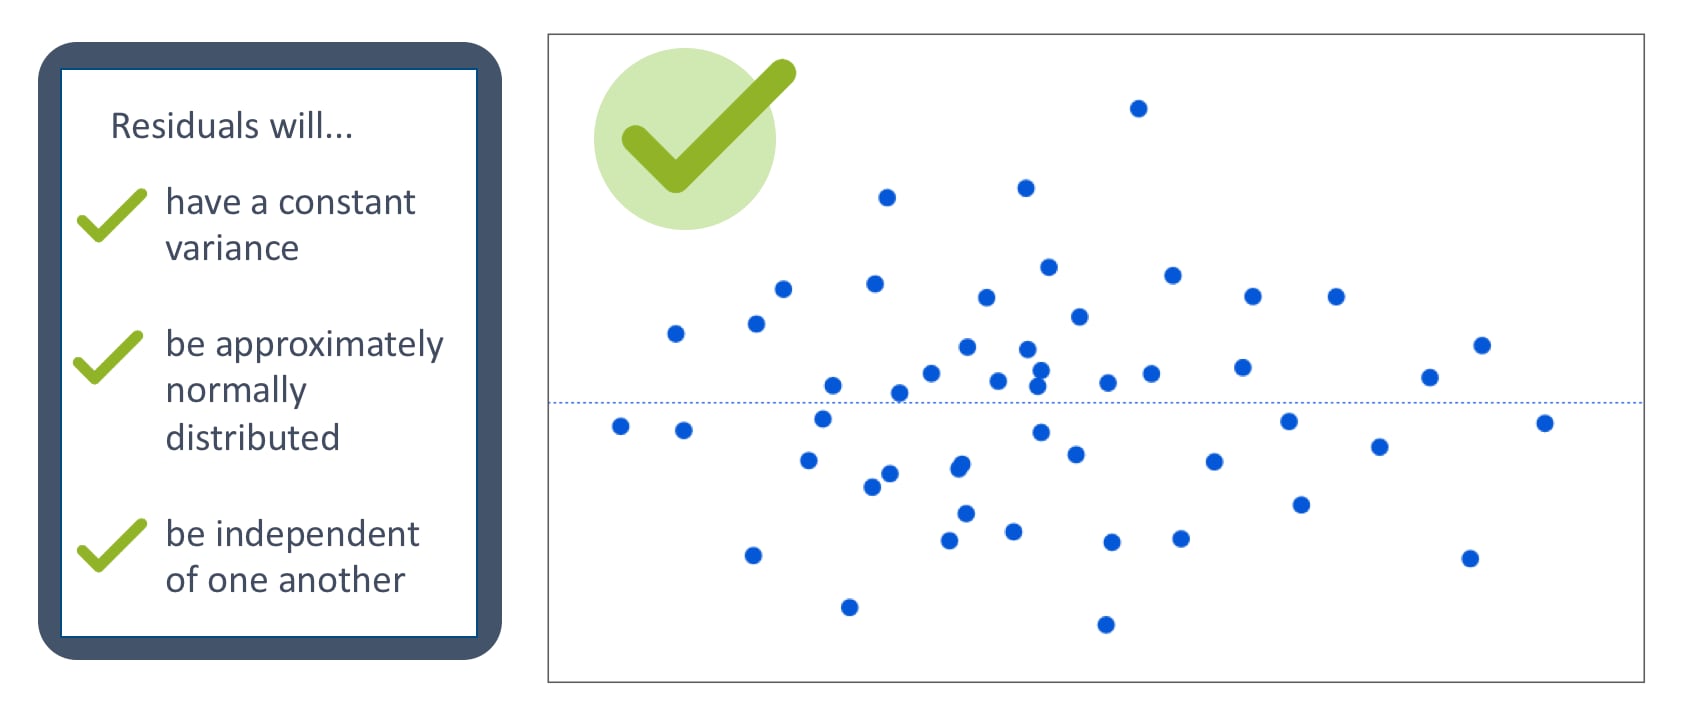
2) Poor statistical properties: By sampling time bars at a constant time interval also gives rise to serial correlations, non-normality, non-IID, and heteroscedasticity.

These properties are against the assumptions of most statistical models, making it a difficult choice for analysis and predictions. These properties arise due to the prevailing market noise and incorrect sampling.
Contents
- Alternative Bars
- Event-Driven Bars
- Tick Bars
- Volume Bars
- Dollar Bars
- Generation Bars
- Real-time Bars
- Historical Bars
Alternative Bars
Are there any solutions that tackle both problems?
The answer is yes. We can solve both problems by sampling on the trading activities. And in this three-part article, I will discuss how to deal with problems using various “alternative” bars. I will talk about various sampling methods and how can you generate alternative bars in Alpaca using its Trade API. Also, we will discuss how you leverage “alternative” bars for building a better trading strategy with examples.
Part - I (Introduction): In this part, we will learn to generate various alternative bars especially event-driven bars like tick bars, volume bars and dollar bars.
Part - II (Analysis & Trading Strategy): In this part, we will analyse various event-driven bars that were generated in Part-I and will also develop a simple trading strategy using the same bars.
Part - III (Integration in Alpaca API and an ML Trading Strategy): In this part, we will learn to build a live machine learning based strategy that uses the Alpaca Trade API integration for alternative bars.
The book Advances in Financial Machine Learning discusses various ideas for generating alternative bars that can categorize as - 1) Event-driven bars and 2) Imbalance/ Information driven bars. In this article, we will only discuss Event-driven bars and the Information driven bars are kept for the future.

Event-Driven Bars
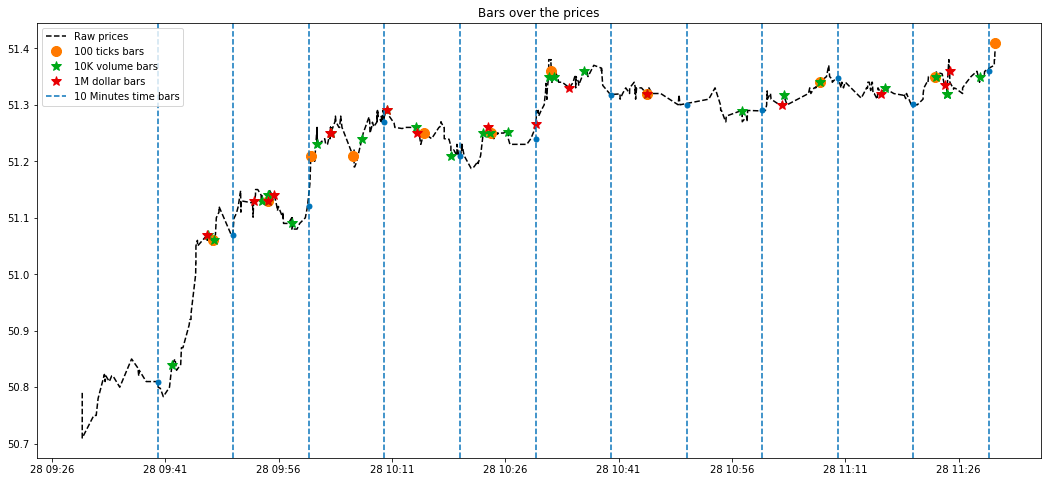
The main objective behind event-driven bars is to overcome asymmetric information contained inside time bars i.e. the bars sampled at a constant time interval and ignore the prevailing market activities or events that are taking place. So, the idea is to sample frequently when there is more information or the market is aggressive and sample less when markets are steady or less informative. To explain it better I would like to consider using an example: A typical stock receives high amounts of volume or trades during the open and closing hours. So bars are generated more frequently during those hours and less during the rest of the day. And by sampling, I mean to aggregate the trades on a trading metric like a number of ticks or volume of trades. And by aggregating on different trade metrics, we can generate bars for that specific aggregating metric.
The below function is responsible for aggregating metrics like volume (cum_volume) and if it exceeds the given threshold a volume bar is sampled. Similarly, we can pass different metrics to aggregate like tick, volume or dollar value and generate tick bars, volume bars or dollar bars respectively.
***Warning: The following code needs access to Polygon tick data therefore if you do not have a funded live trading account through Alpaca you will receive a Warning Code 1000 followed by an error message of “Invalid Polygon Credentials”.***
def aggregate_bar(self, data):
        """
        Aggregate with the arrival of new trades data

        :param data : A data object containing the ticks of a
                      single timestamp or tick.
        """
        self.cum_count['cum_tick'] += 1
        self.cum_count['cum_volume'] += data.size
        self.cum_count['cum_dollar_value'] += data.price*data.size
        self.price.append(data.price)
        self.volume.append(data.size)
        #check the side of the trade
        tick_sign = self._check_tick_sign(data.price)
        if tick_sign > 0:
            self.cum_count['cum_buy_tick'] += 1
            self.cum_count['cum_buy_volume'] += data.size
            self.cum_count['cum_buy_dollar_value'] += data.price*data.size

        if self.cum_count[self.stat] >= self.threshold:
            #getting the vwap
            vwap = np.multiply(self.price, self.volume).sum()/
                   sum(self.volume)
            bar = {'timestamp': str(data.timestamp),
                   'symbol' : data.symbol,'open':self.price[0],
                   'high':max(self.price), 'low': min(self.price),
                   'close': data.price, 'vwap' : vwap}
            #join the cumulative metrics to the bar
            bar.update(self.cum_count)
            #save the bar
            self.save_bar(list(bar.values()))
            print(bar)
            self._reset_cache()
            return bar
        return False
Tick Bars
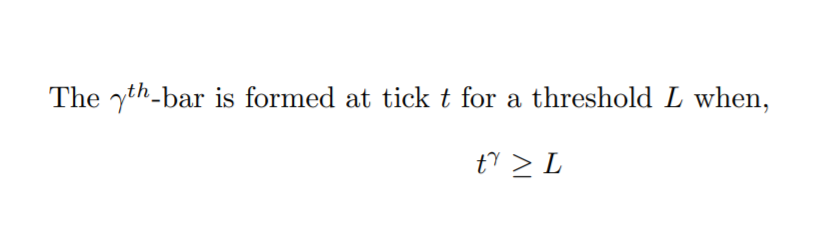
The intuition behind tick bars is that we will sample a bar when a predefined number of transactions (or ticks/trades) takes place. E.g. - We set the algorithm to sample a bar when 10000 ticks (threshold) of a particular asset have been completed. This way we can know the arrival of new information in the market because the bars will be formed frequently.
def get_tick_bars(symbols:Union[str, list], threshold:Union[int, dict],
                  save_to:str):
    """
    Get RealTime Tick Bars.

    :param symbols :(str or list) a ticker symbol or a list of ticker
                    symbols to generate the bars.
    :param threshold :(int or dict) threshold for bar formation or
                      sampling. A dictionary must be given if bars
                      to generate for multiple symbols. The dictionary
                      keys are ticker symbols and values are the
                      thresholds respectively.
    :param save_to :(str) the path to store the bars.
    :return :(None)
    """
    get_bars('tick_bar', symbols, threshold, save_to)
Volume Bars
It aims to solve the problem order fragmentation which is very common with electronic trading. Instead of sampling for number transactions, we can sample for actual volume that was traded i.e. for a pre-defined number of shares that was exchanged. E.g. - we can sample a bar every time 10000 shares (threshold) of an asset was traded, without considering how many transactions it had involved.
/investing12-5bfc2b8f46e0fb00517be087.jpg)
def get_volume_bars(symbols:Union[str, list], threshold:Union[int, dict],
                    save_to:str):
        """
        Get RealTime Volume Bars.

        :param symbols :(str or list) a ticker symbol or a list of ticker
                        symbols to generate the bars.
        :param threshold :(int or dict) threshold for bar formation or
                          sampling. A dictionary must be given if bars
                          to generate for multiple symbols. The dictionary
                          keys are ticker symbols and values are the
                          thresholds respectively.
        :param save_to :(str) the path to store the bars.
        :return :(None)
        """
        get_bars('volume_bar', symbols, threshold, save_to)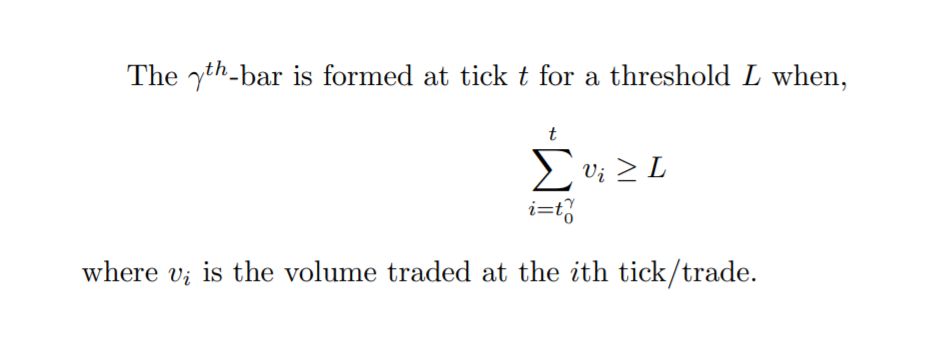
Dollar Bars
The idea behind dollar bars is that we will sample a bar when a predefined amount of dollar value is exchanged in the market. This way we can try to analyse significant price movements empirically. E.g. - we can sample a bar for SPY ETF whenever 10 million dollars (threshold) worth of shares has been exchanged/traded. The dollar value of a trade is the share traded times the share price of that asset.
def get_dollar_bars(symbols:Union[str, list], threshold:Union[int, dict],
                    save_to:str):
        """
        Get RealTime Dollar Bars.

        :param symbols :(str or list) a ticker symbol or a list of ticker
                        symbols to generate the bars.
        :param threshold :(int or dict) threshold for bar formation or
                          sampling. A dictionary must be given if bars
                          to generate for multiple symbols. The dictionary
                          keys are ticker symbols and values are the
                          thresholds respectively.
        :param save_to :(str) the path to store the bars.
        :return :(None)
        """
        get_bars('dollar_bar', symbols, threshold, save_to)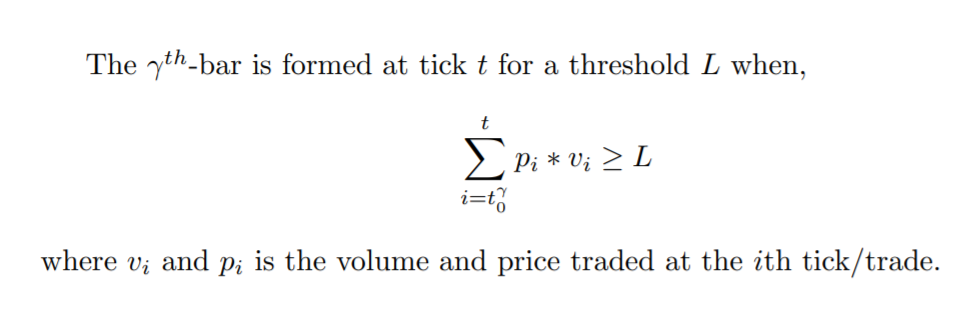
Generation Bars
Currently, I am working on integrating the event-driven bars with Alpaca API, so that a user can generate the bars in real time directly from the API. But till the time a developer can clone the GitHub repo of this project and follow instructions.
 Harkishan-99
First of all to get the streaming data we need to connect to the Alpaca API. We will be using the WebSocket streaming API to receive data in real time and aggregate them. So, I created a convenient script called connection.py which contains a Client class that initializes the connection with the API using the API credentials from a config file.
import configparser as ConfigParser
import alpaca_trade_api as tradeapi

class Client:
    """
    A class to establish a connection with the brokers API.
    """

    def __init__(self):
        """
        Establish the API connection
        """
        configParser = ConfigParser.RawConfigParser()
        configFile = 'config.cfg'
        configParser.read(configFile)
        self.api_key = configParser.get('alpaca', 'api_key')
        self.api_secret = configParser.get('alpaca', 'api_secret')
        self.base_url = configParser.get('alpaca', 'base_url')

    def connect(self):
Bars are generated using the get_bar function assigning different aggregating metrics for different bar types. The function creates CSV file for saving the generate bars and assigns the column headers if the file doesn’t exist before. Else, it will append the bar to the same existing file. Then we create instances of the EventDrivenBar class for all the symbols and set an event handler to handle the incoming trades in an asyncio loop and aggregate it till the threshold is met. The bar is then appended to the CSV file. Sample datasets of bars can be seen in the Github repository of this project under sample datasets.
def get_bars(bar_type:str, symbols:Union[str, list],
             threshold:Union[int, dict], save_to:str):
    """
    Get the realtime bar using the Streaming API.

    :param bar_type :(str) Type of bar to form. Either "tick_bar",
                    "volume_bar" or "dollar_bar".
    :param symbols :(str or list) a ticker symbol or a list of ticker
                    symbols to generate the bars.
    :param threshold :(int or dict) threshold for bar formation or
                      sampling. A dictionary must be given if bars
                      to generate for multiple symbols. The
                      dictionary keys are ticker symbols and values
                      are the thresholds respectively.
    :param save_to :(str) the path to store the bars.
    """
    #create a save file and a directory structure
    save_to = save_to + '/' + bar_type
    if not os.path.exists(save_to):
        os.makedirs(save_to)
    #the file path and name
    save_to = save_to + '/' + 'realtime.csv'
    #check if the file exist
    if not os.path.exists(save_to):
        #write the header of the CSV file
        with open(save_to, 'w', newline='') as f:
            #the header
            header_ = ['timestamp', 'symbol', 'open', 'high',
                       'low', 'close', 'vwap', 'cum_tick',
                       'cum_volume', 'cum_dollar_value','cum_buy_tick',
                       'cum_buy_volume', 'cum_buy_dollar_value']
            # Create a writer object from csv module
            csv_writer = csv.writer(f)
            # Add contents of list as last row in the csv file
            csv_writer.writerow(header_)
    #if the file exists then we will append the bars to the same file.
    #initiate instances of symbols
    instances = {}
    if isinstance(symbols, list):
        #multi-symbol
        channels = ['trade_updates']+['T.'+sym.upper() for sym in symbols]
        for symbol in symbols:
            #create a separate instance for each symbols
            instances[symbol] = EventDrivenBars(bar_type,
                                                threshold[symbol],
                                                save_to)
    else:
        #single symbols
        channels = ['trade_updates', f'T.{symbols.upper()}']
        if isinstance(threshold, int):
            #threshold is given as a int type
            instances[symbols] = EventDrivenBars(bar_type,
                                                 threshold,
                                                 save_to)
        elif isinstance(threshold, dict):
            #threshold is given as a dict type
            instances[symbols] = EventDrivenBars(bar_type,
                                                 threshold[symbol],
                                                 save_to)
        else:
            raise TypeError(f'The given threshold is a {type(threshold)}\
                            expecting a int or a dict')

    @conn.on(r'T$')
    async def on_trade(conn, channel, data):
         if data.symbol in instances and data.price > 0 and data.size > 0:
             bar = instances[data.symbol].aggregate_bar(data)

    conn.run(channels)
Real-time Bars
To generate the bars in real time users need to set up the config file with their API credentials i.e. api_key and api_secret.

[alpaca]
api_key = "enter your api key here without quotes"
api_secret = "enter your api secret here without quotes"
base_url = https://paper-api.alpaca.markets
Now, the bars can be generated using the bars.py script. In the example code below I have how the setups for generating types of event-driven bars discussed in this article. I have defined the same threshold for all the individual assets but it is not recommended as different assets have unique trading properties like market capitalization, liquidity, share price etc. So, it is highly recommended to use a threshold specific to an asset. We will discuss more on thresholds and analyse how it affects the properties of the bars in the next part of this blog.
from bars import get_tick_bars, get_volume_bars, get_dollar_bars

#assets for receiving the event-driven bars
symbols = ['AAPL','TSLA','AMZN']
#setting static threshold for individual stocks for different bars
tick_bar_threshold = {'AAPL':1000,'TSLA':1000,'AMZN':1000}
volume_bar_threshold = {'AAPL':50000,'TSLA':5000,'AMZN':50000}
dollar_bar_threshold = {'AAPL':2000000,'TSLA':2000000,'AMZN':2000000}

#setup for receiving tick bars for given thresholds
get_tick_bars(symbols, tick_bar_threshold, 'sample_datasets')
#setup for receiving volume bars for given thresholds
get_volume_bars(symbols, volume_bar_threshold, 'sample_datasets')
#setup for receiving dollar bars for given thresholds
get_dollar_bars(symbols, dollar_bar_threshold, 'sample_datasets')
Historical Bars
Since alternative bars heavily depends on the quality of tick data and for generating the historical bars and a good amount of historical tick data is required. I haven’t included a code for generating historical bars because there is an excellent Python package called mlfinlab, which can be used if you have some cleaned and quality historical tick data. I will highly suggest using mlfinlab, it has a good set of documentation and IPython notebooks demonstrating the use.
hudson-and-thamesBonus
As a bonus, I would like to talk about the intra-bar factors/features that can be generated. In this article, we have generated cumulative factors like total buy volume, total buy dollar value etc. These features can be used to determine how much volume of a candle/bar is buy initiated and vice-versa. Also, you can add your intra-bar factors like entropy, kyle-lambda or other market microstructure features, with minimal modification of the original code. You can read more about these factors in the book Advances in Financial Machine Learning (Chapter - 18 and 19). I will add some more features in the coming time, I also welcome contributions. Some of these factors will be explained in depth while we develop a trading strategy in the coming parts of this article.


Links
To understand the idea of Alternative Bars in depth I recommend you the following resources and also the book mentioned above:
 Maks Ivanov
 Gerard Martínez
 hudson-and-thames
***Once again, the following code discussed today needs access to Polygon tick data therefore if you do not have a funded live trading account through Alpaca you will receive a Warning Code 1000 followed by an error message of “Invalid Polygon Credentials”.***
**This project’s Github Repository: https://github.com/Harkishan-99/Alternative-Bars
Harkishan-99Technology and services are offered by AlpacaDB, Inc. Brokerage services are provided by Alpaca Securities LLC (alpaca.markets), member FINRA/SIPC. Alpaca Securities LLC is a wholly-owned subsidiary of AlpacaDB, Inc.
You can find us @AlpacaHQ, if you use twitter.