Backtesting Your Way To Confident Trading
In the fast-paced world of options trading, success hinges on making informed decisions amidst a sea of uncertainty. Enter backtesting, your potent weapon for navigating this volatile landscape. Backtesting allows you to time-travel through market data, replaying your options strategies on historical prices to see how they would have fared. Think of it as a crystal ball for financial foresight! We will explore the art and science of backtesting in options trading — from setting realistic assumptions to avoiding common pitfalls like overfitting and data-snooping bias.
This guide equips you with the knowledge and tools to create, test, and refine your algorithmic options trading. You’ll understand the power of historical analysis plus how it applies to algorithmic trading and options theory.
Why Do You Backtest Options Strategies?
Options trading demands a pragmatic, measured approach.
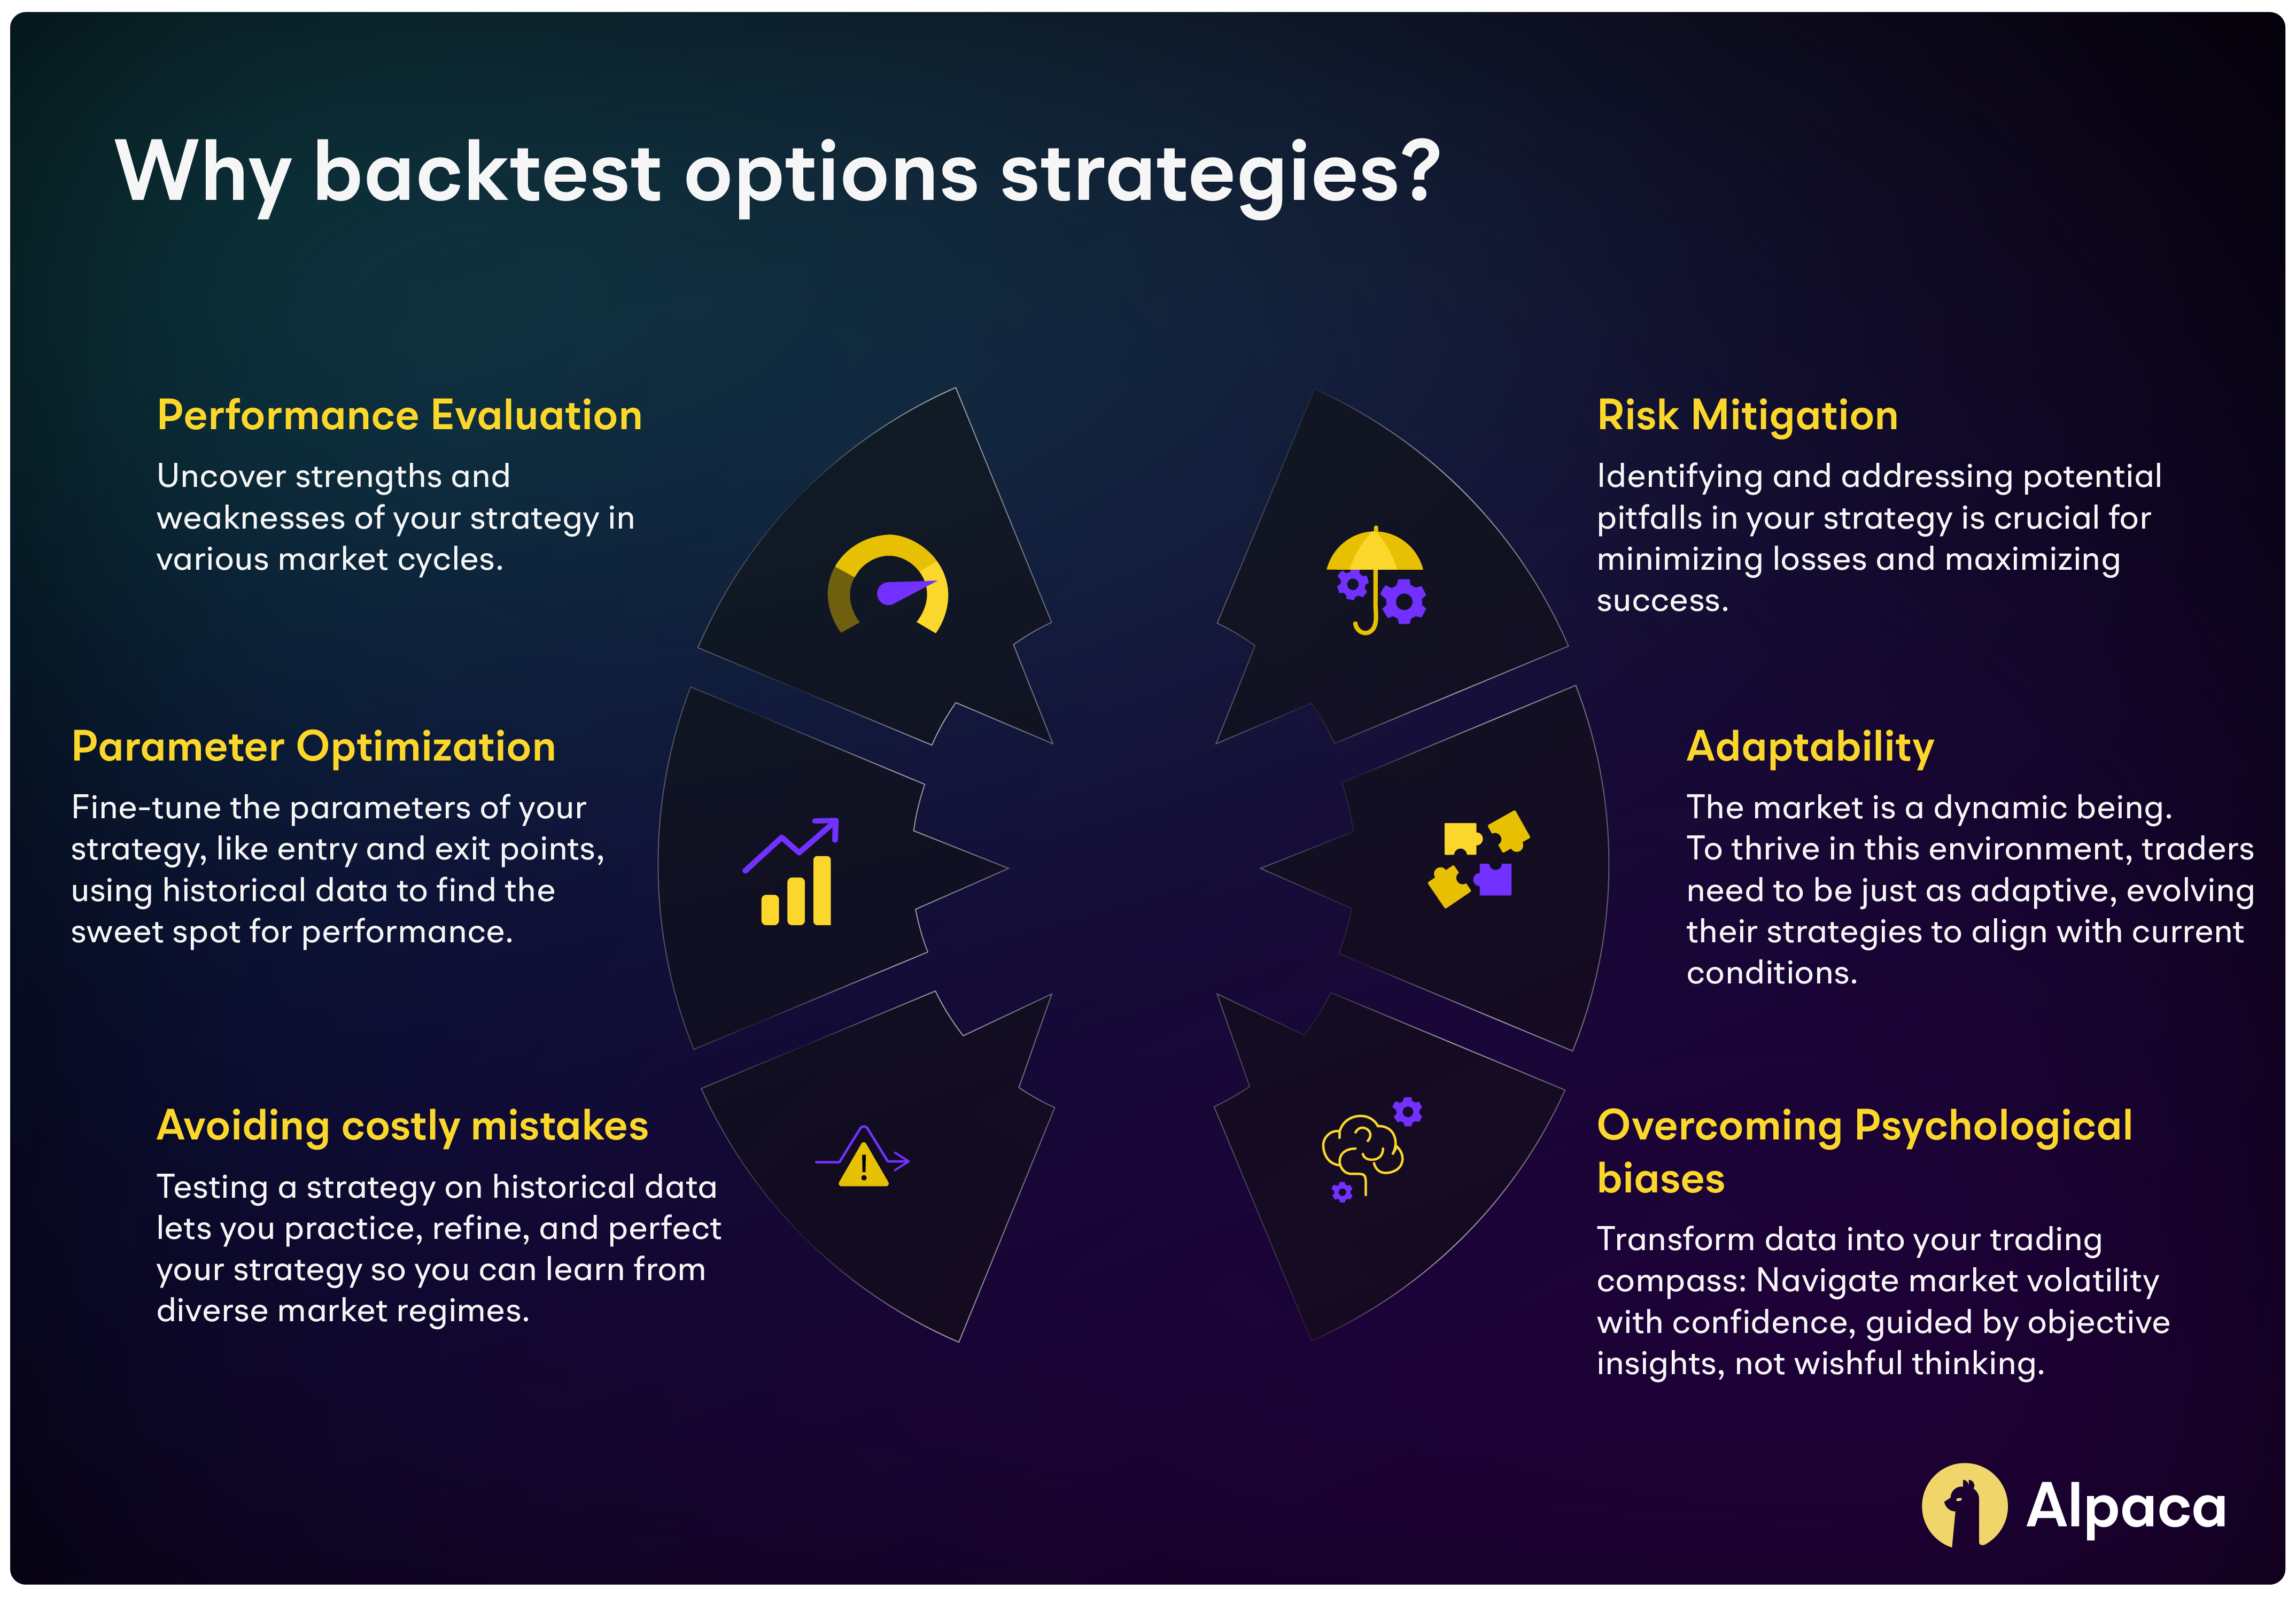
Backtesting provides invaluable insights that translate to better trading decisions:
1. Performance Evaluation: Witness firsthand how your strategy would've handled different market conditions, uncovering its strengths and weaknesses in bull, bear, and sideways markets.
2. Risk Mitigation: Identify potential pitfalls and optimize your strategy to minimize losses and maximize profit opportunities.
3. Parameter Optimization: Fine-tune the parameters of your strategy, like entry and exit points, using historical data to find the sweet spot for performance.
4. Confidence Booster: Witnessing your strategy's potential success in past scenarios can instill confidence and guide your real-world trades.
5. Adaptability: Markets evolve over time, and strategies that worked in the past may not work in the future. Regular backtesting with updated data helps in adapting and evolving strategies to align with current market conditions.
6. Avoiding Costly Mistakes: By testing a strategy on historical data before deploying real capital, traders can avoid potentially costly mistakes. It’s a way to learn and improve without the financial risk of live trading.
7. Overcoming Psychological Biases: When venturing into the dynamic world of options trading, the potential for amplified gains and losses can further exacerbate our psychological biases. These mental shortcuts, while often helpful in everyday life, can lead to costly mistakes in the market. Traders can rely on data and analytics rather than gut feelings or emotions, leading to more disciplined and objective trading decisions.
How Far Back Do You Test? Unveiling the Backtesting Duration Dilemma
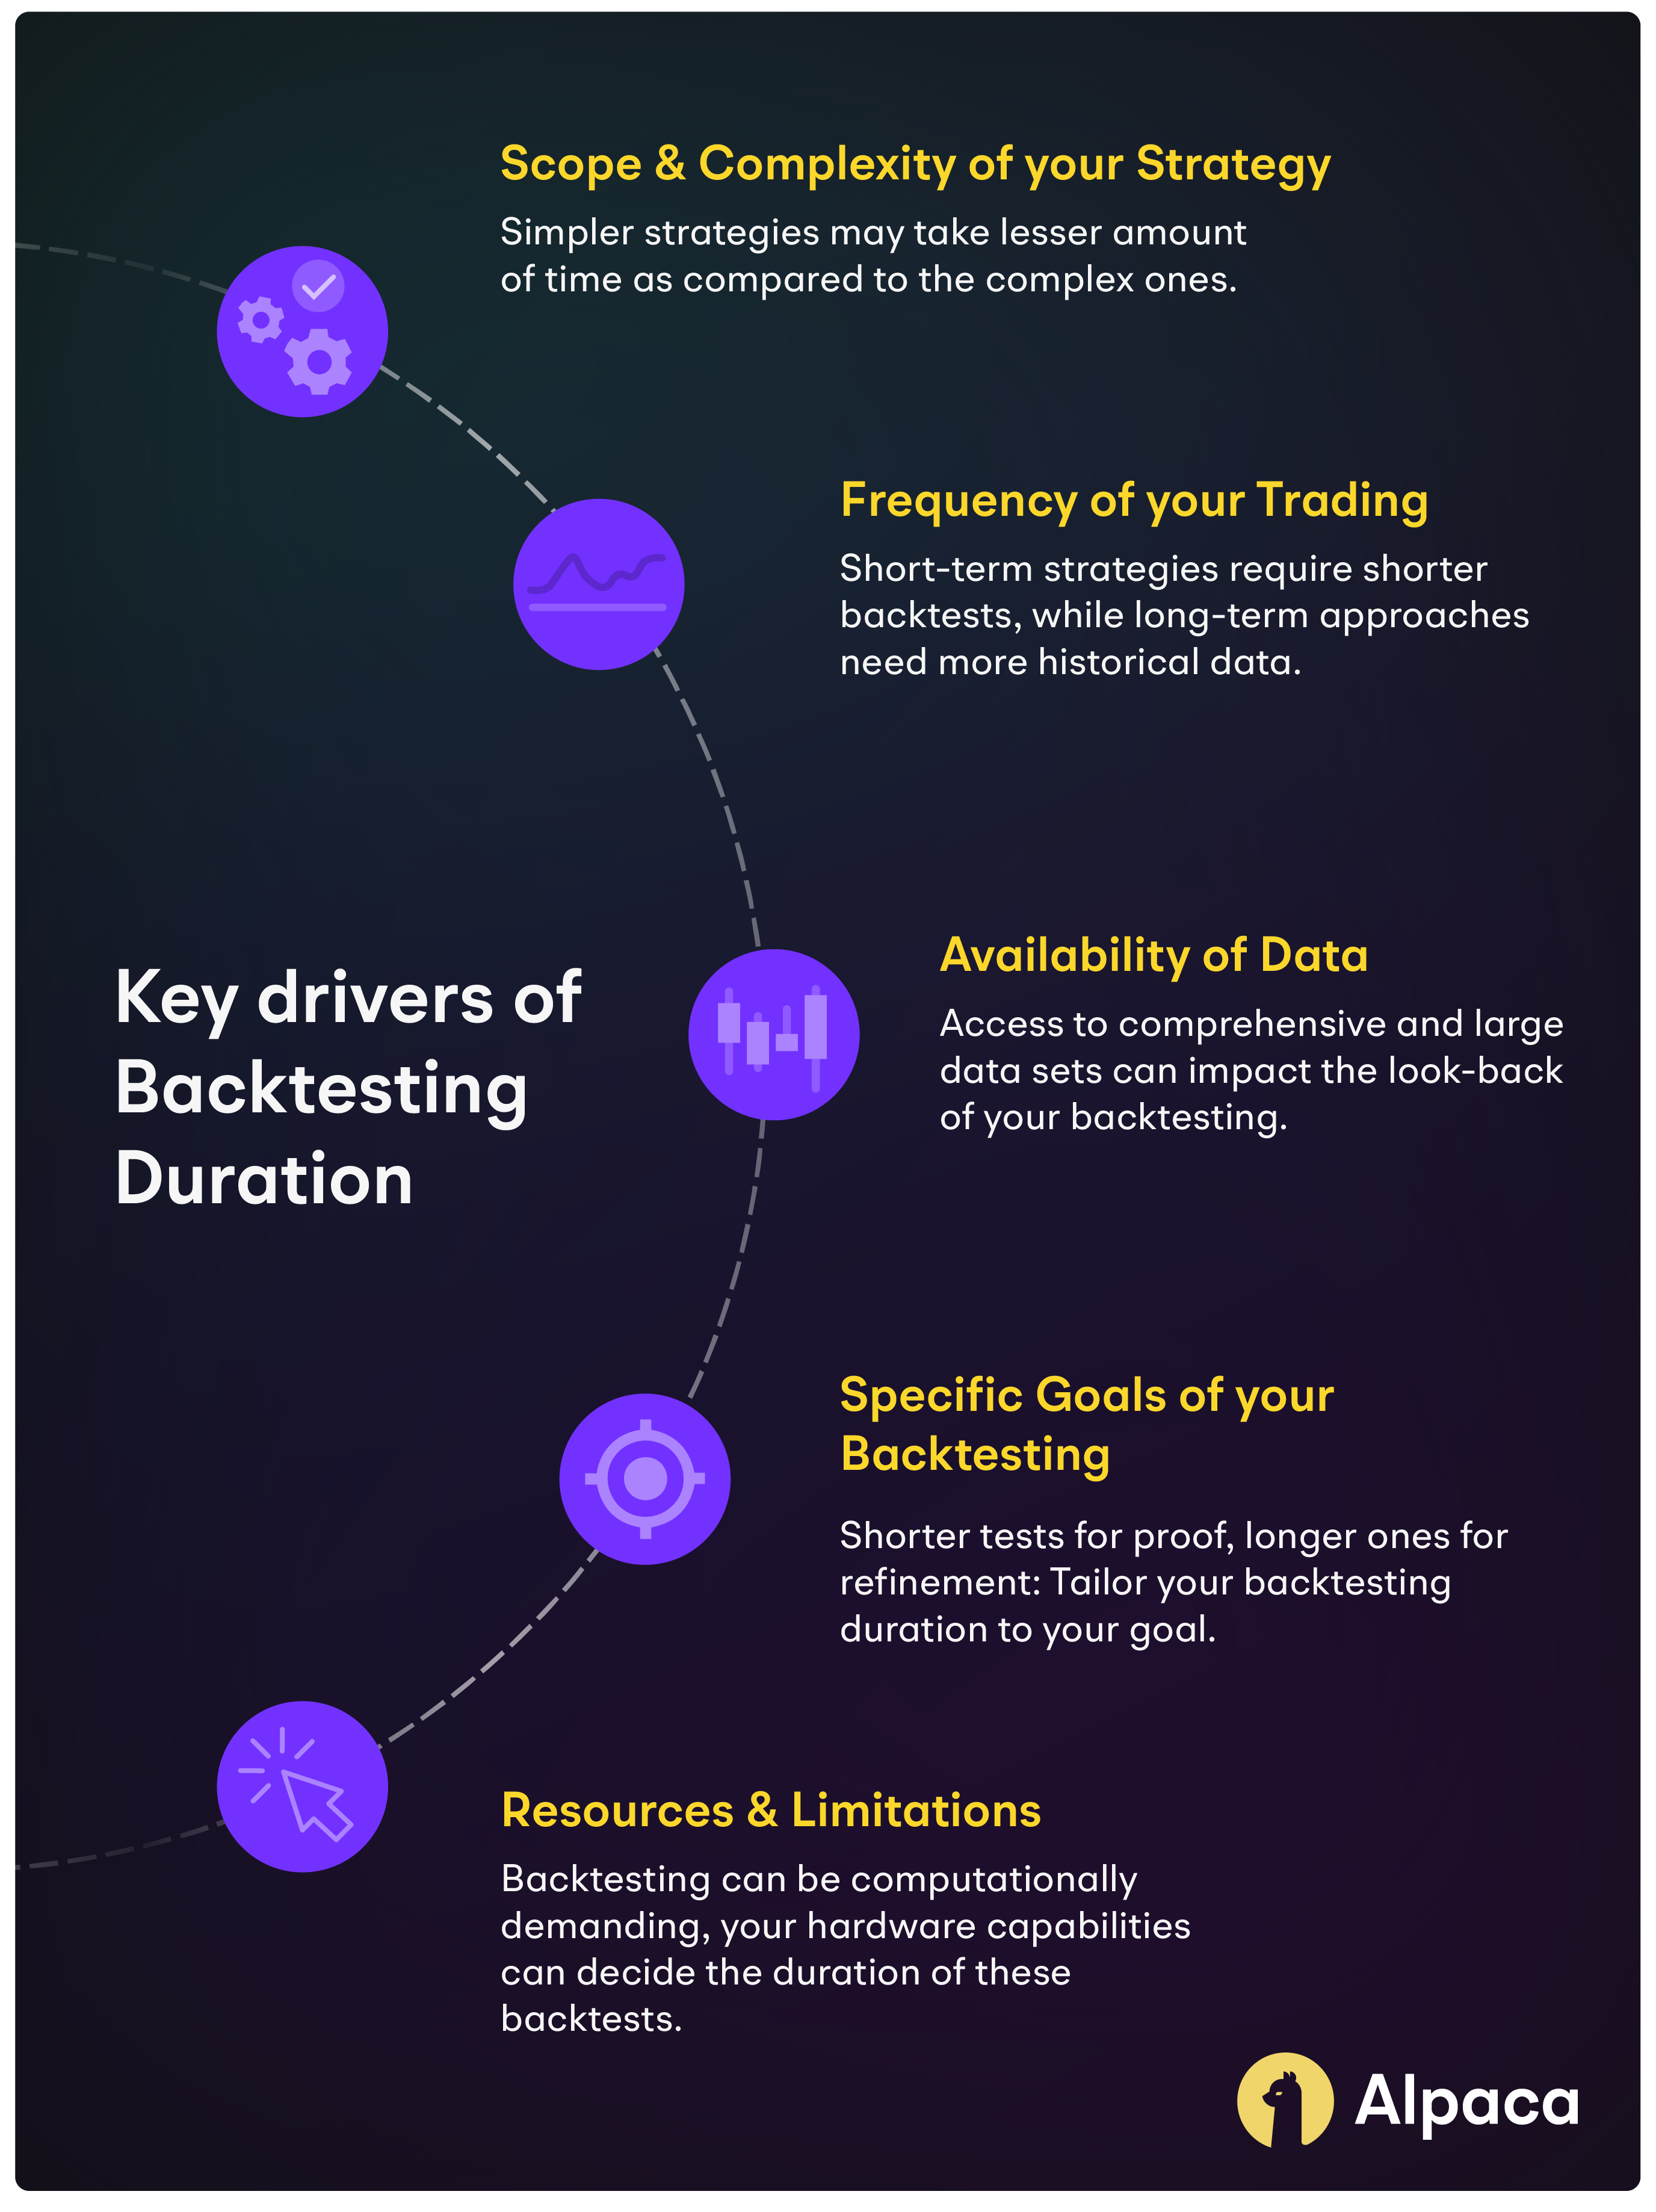
The expected time frame for backtesting options trading strategies can vary significantly depending on several factors.
Here are key considerations that influence the duration of the backtesting process:
1. Scope and complexity of your strategy:
- Simpler strategies: For less complex strategies with few variables, backtesting on 3-5 years of historical data might be sufficient to provide valuable insights.
- Complex strategies: More intricate strategies with numerous variables might require longer data sets, potentially spanning 10 or even 20 years to capture diverse market conditions and assess their effectiveness across different market cycles.
2. Frequency of your trading:
- Short-term traders: If you focus on short-term trades like day trading, backtesting on shorter time frames like months or even weeks might be relevant, capturing recent market dynamics and volatility patterns.
- Long-term traders: For long-term investment strategies, using extended time frames like 10 or more years is desirable to evaluate how your strategy performs across various market cycles and economic changes.
3. Availability of data:
- Data limitations: Access to comprehensive historical data can impact your backtesting timeframe. If you're limited to shorter data sets, consider focusing on recent market cycles or adapting your strategy to the available data.
- Large data sets: Abundant historical data allows for extensive backtesting across different periods and market conditions, providing a more robust analysis of your strategy's performance.
4. Specific goals of your backtesting:
- Identifying weaknesses: If you primarily aim to identify potential weaknesses in your strategy, shorter backtesting periods might be sufficient to pinpoint recurring issues.
- Optimizing parameters: To fine-tune specific parameters of your strategy, using a longer timeframe with diverse market conditions can help assess the effectiveness of different parameter settings.
5. Resources and limitations:
- Computational power: Backtesting can be computationally demanding, especially for complex strategies and large data sets. Consider your hardware limitations and available resources when deciding on the backtesting timeframe.
- Time constraints: If you have limited time for backtesting, prioritize analyzing recent market cycles or focus on shorter-term strategies that require less data processing.

Setting Up a User-Friendly BackTesting Development Environment
Setting up a development environment conducive to backtesting involves several key components and considerations to ensure efficiency, accuracy, and ease of use.
Here are some an extensive list of recommendations:
- Trading Platform: Select a platform that supports backtesting like Alpaca. Consider whether you need a no-code/low-code platform or one that requires programming skills, depending on your expertise.
- Programming Language: If coding is involved, choose a language well-suited for financial analysis and backtesting, such as Python, R, MATLAB or C++.
- Integrated Development Environment (IDE): Use an IDE that complements your chosen programming language, like PyCharm for Python, RStudio for R, or MATLAB's native IDE.
- Historical Market Data: Ensure access to reliable historical market data, which is critical for backtesting. This can include price data, volume data, and other relevant financial metrics.
- Database Solutions: Consider using database solutions like SQL databases for efficient data storage and retrieval. Cloud-based solutions can also be used for scalability and remote access.
- Data Cleaning Tools: Have tools and scripts ready for data cleaning and preprocessing to ensure the quality and accuracy of your data.
- Processing Power: Ensure your system has adequate processing power and memory to handle complex calculations and large datasets.
- Cloud Computing: Consider cloud computing options for scalability, especially if you're working with vast amounts of data or complex models.
- Multiple Monitors: Having multiple monitors can be beneficial for simultaneously viewing code, charts, and data.
- Use Version Control Systems: Implement version control using tools like Git. This is crucial for tracking changes, collaborating with others, and maintaining a robust development process.
- Backtesting Libraries and Frameworks: Leverage existing libraries and frameworks specific to your chosen programming language, like backtrader or PyAlgoTrade for Python, to streamline the backtesting process.
- Risk Analysis Tools: Incorporate risk management tools to evaluate the risk associated with your trading strategies. This includes drawdown analysis, Sharpe ratio, and other risk/reward metrics.
- Keep Detailed Records: Document your strategies, tests, and results meticulously. This helps in refining strategies and analyzing past performances.
- Dedicated Testing Environment: Set up a dedicated testing environment that mimics real-world trading as closely as possible. This should include testing for different market conditions and stress testing.
- Implement Performance Metrics: Incorporate tools for measuring the performance of your strategies. This includes metrics like return on investment (ROI), alpha, beta, and others.
- Continuous Learning and Improvement: The financial markets are always evolving, so it's important to stay updated with new tools, techniques, and market conditions. Continuous learning should be a part of your development environment.
By considering these elements, you can create a development environment that is well-suited for backtesting trading strategies, ensuring that you have the necessary tools, data, and infrastructure to conduct thorough and effective analyses.
Backtesting Options Strategies with Python
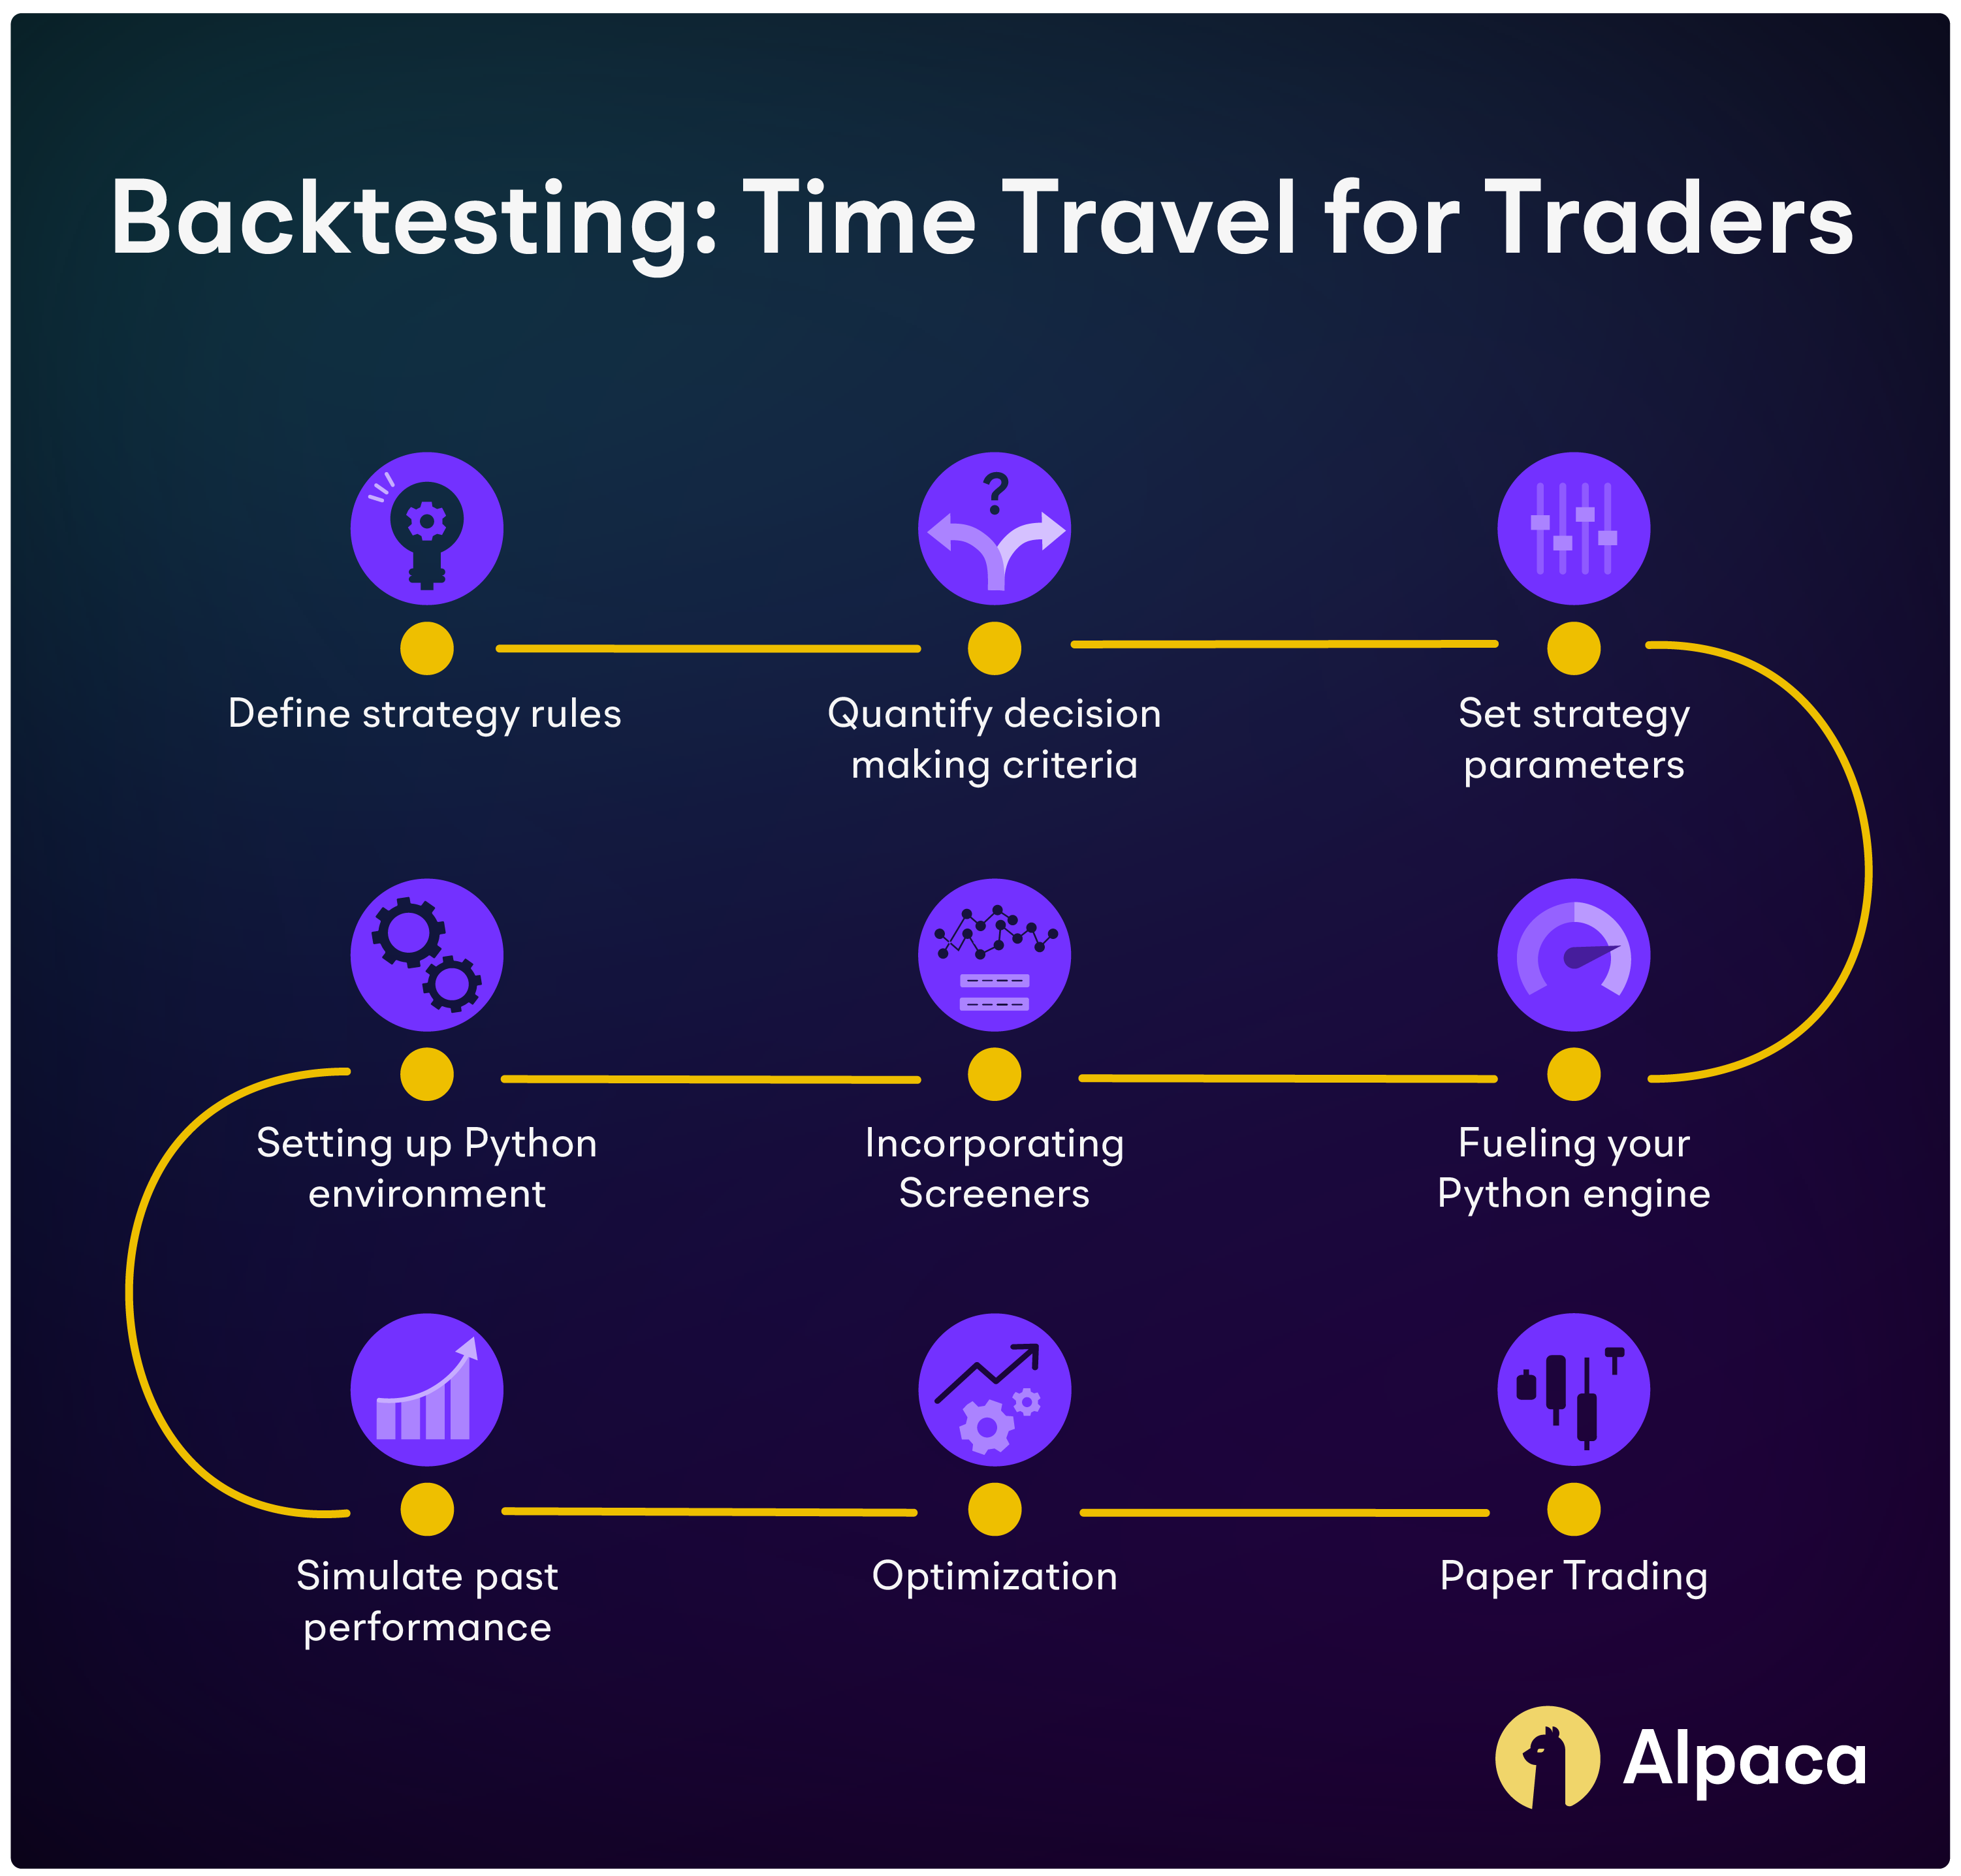
Ever wondered how effective your options trading strategy truly is? Enter backtesting – the powerful technique using Python that lets you simulate its performance on historical data. Think of it as a time machine for your trading ideas!
Let's conduct a backtest example using an iron condor options strategy.
Backtest Options Example: Iron Condor
1. Define the Strategy Rules:
This strategy involves selling OTM (out of the money) calls and puts and buying further OTM call and put options with all the options contracts expiring today.
Rules might include selecting strike prices, expiration dates, and conditions for entering, exiting, or adjusting positions.
2. Setting Up the Python Environment
- Python Installation: Ensure Python is installed on your system, here’s Alpaca’s official Python SDK on Github.
- Required Libraries: Install necessary libraries such as pandas for data handling, numpy for numerical operations, options pricing library like Mibian and technical indicators library such as Talib.
 # Data manipulation
 import pandas as pd
 import numpy as np

 # Technical analysis
 import talib as ta

 # Date time manipulation
 from datetime import timedelta

 # For plotting
 import matplotlib.pyplot as plt
 %matplotlib inline
 plt.style.use ('seaborn-darkgrid')

 # to compute greeks
 import mibian

 # Ignore warnings
 import warnings
 warnings.simplefilter('ignore')
3. Fueling Your Python Engine: Data Acquisition and Collection
Before your Python trading masterpiece can take flight, it needs fuel – historical market data. You have two options: paying for premium data from vendors, or tapping into free resources like Yahoo Finance. Once the data arrives, it needs a home – a well-structured database for analysis. Think of it as your trading brain's library, keeping everything organized and accessible.
This database has two key sections:
Underlying Data: Historical OHLCV data for the underlying that includes Open, High, Low, Close, Volume.
Options Data: The second part of the data structure is the options data. This includes the volume data, bid/ask quotes, open interest, strike price, expiry, and the last traded price.
But remember, quality matters! Before feeding your Python code, ensure the data is clean. Avoid "Garbage in, garbage out" syndrome where bad data leads to faulty analysis and potentially disastrous trades.
# Read data
df = pd.read_csv('spx_01x_202306_dayExpiry.txt')
df.tail(20)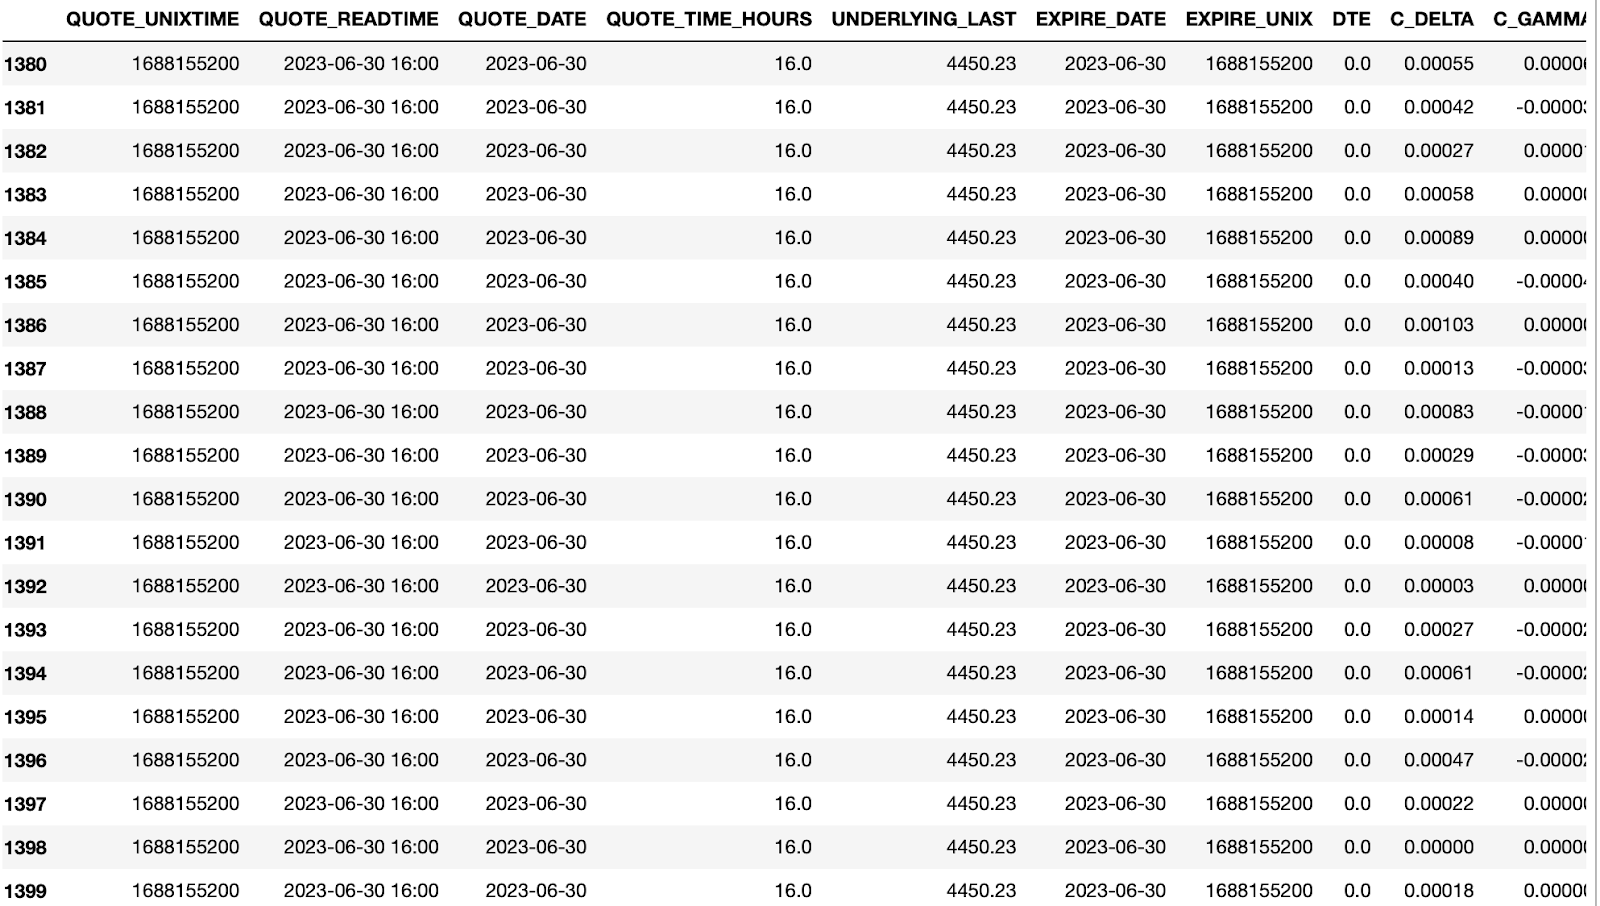
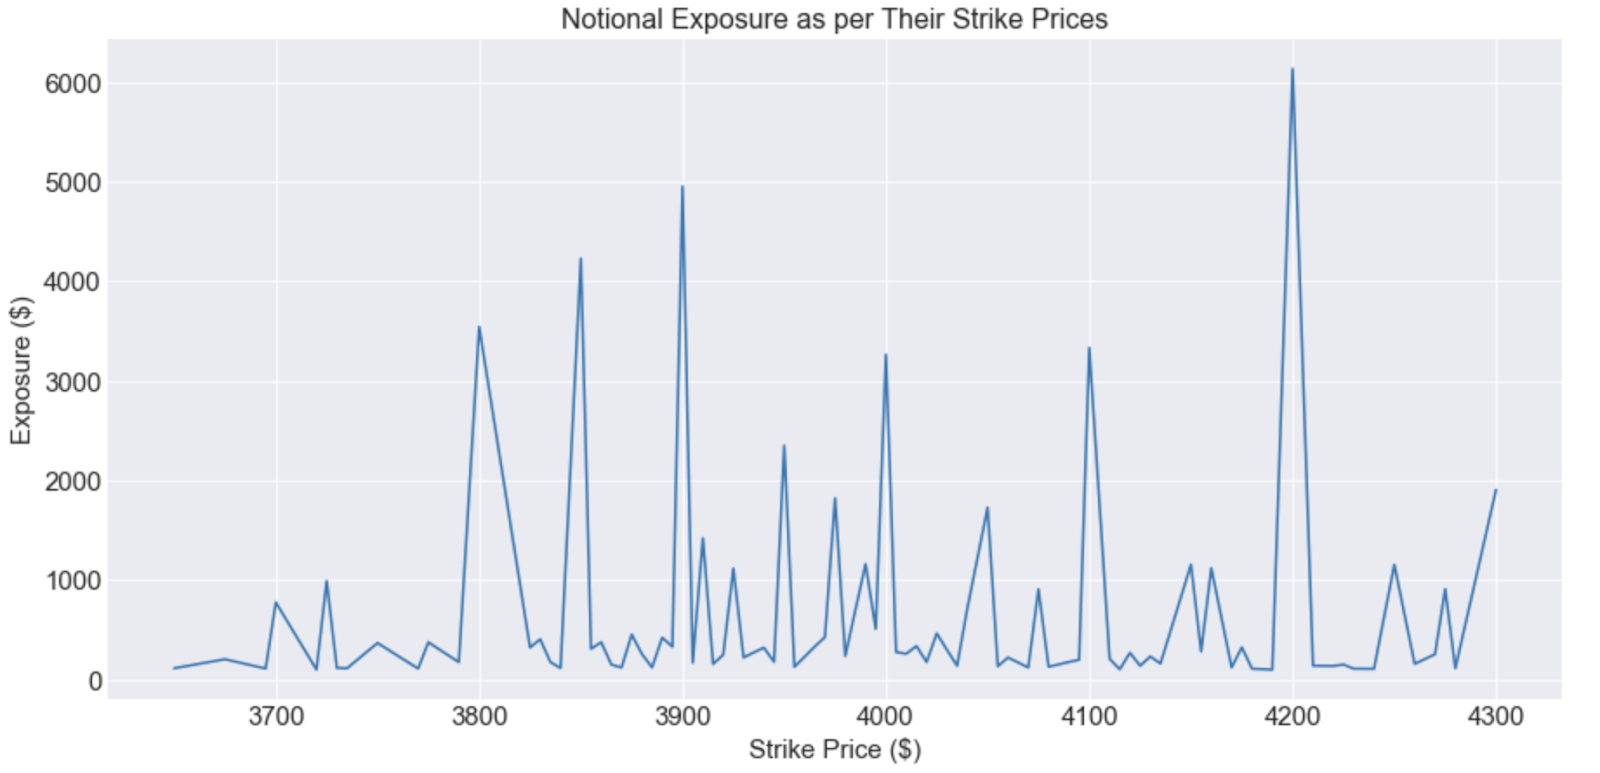
4 . Incorporating Screeners: Conquering Options Analysis Paralysis using Screeners
Now you have a quality database but the problem is that it's too large. There are numerous strike prices, each having their own bid-ask, implied volatility, open interest, volume, last traded price, and option Greek values like delta, gamma, vega, theta spread across multiple expiries. So it's very much possible to get overwhelmed by the quantity of data. And it can get very confusing for you to shortlist your options. To optimize your backtesting process and avoid analysis paralysis, you can consider filtering out options based on liquidity factors. One approach is to ignore strike prices with zero bid-ask values or low open interest.
# Ignore Strikes With Zero Bid or Ask Values

# Select the call options data that has bid values different from 0.
call_options_data = call_options_data. loc[call_options_data['Bid'l != 0]

# Select the call options data that has ask values different from 0.
call_options_data = call_options_data. loc[call_options_data['Ask'] != 0]

# Select the put options data that has bid values different from 0.
put_options_data = put_options_data. loc (put_options_data['Bid'] != 0]

# Select the put options data that has bid values different from 0.
put_options_data = put_options_data. loc[put_options_data[' Ask'] != 0]


# Skip Strikes With Low Open Interest

# Set the exposure threshold as 100 million dollars
notional_exposure_threshold = 100

# Set the options lot size
options_lot_size = 100

# Compute the notional exposure for each option contract
call_options_data['notional_exposure'] = call_options_data['Strike'] * \
Options_lot_size /10**6

# Compute the open interest notional exposure
call_options_data['0I_notional_exposure'] = call_options_data['notional_exposure'] * \
call_options_data['open Interest']

# Select the data with a notional exposure higher than the threshold
call_options_data = call_options_data[call_options_data['0I_notional_exposure']
> notional_exposure_threshold]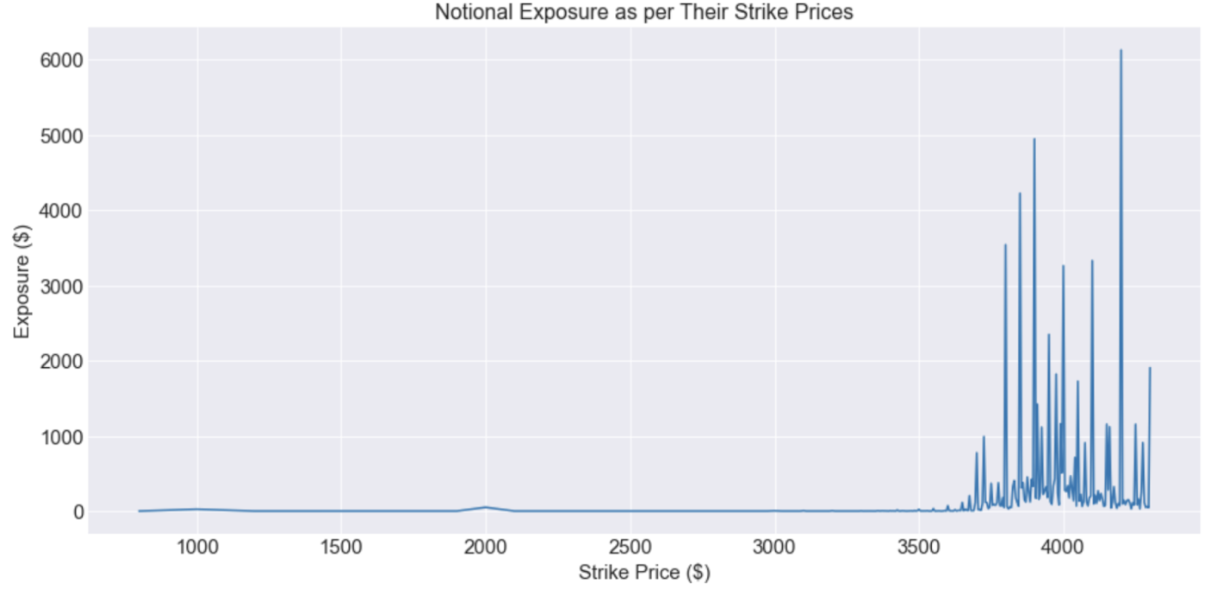
5. Quantify Decision-Making Criteria:
Translate qualitative criteria into quantitative parameters,e.g.Initiate the Iron Condor under these conditions, first, the Implied Volatility Percentile (IVP) of the underlying should be between 50 and 95 and second the RSI values should be between 40 and 65. Set Take Profit parameters at 50% and Stop loss as 125% of the credit received. Implement other risk management rules to protect against large losses. This could include allocation methodology, position sizing rules, and other diversification strategies.
def get_entry_exit_signals(data, options_data, stoploss_percentage=1.25, take_profit_percentage=0.5, days_to_exit=0):
    '''
This function uses input data for open, high, low, and close (OHLC) prices along with options data to compute the Relative Strength Index (RSI), Implied Volatility Percentile (IVP), and the number of days until the options expire. It establishes criteria for both entering and exiting trades based on the RSI, IVP, and the days to expiry, including considerations for take profit and stop loss levels. Based on these criteria, it generates trading signals. The output is the data enhanced with these generated signals.
    '''
      # Parameters
      parameters = {
        'stoploss_percentage': stoploss_percentage,
        'take_profit_percentage': take_profit_percentage,
        'days_to_exit': days_to_exit
    }

     #Our entry conditions are based on RSI indicator and IVP. We will create two columns: RSI and IVP to store the RSI and IVP values.
    #We will use RSI function from the talib library to calculate RSI and IVP is calculated using get_IVP function

    # Calculate RSI
    data['RSI'] = talib.RSI(data['Close'].values, timeperiod=14)
    # Calculate IVP
    data['IVP'] = get_IVP(data, options_data, window=60)
    # Calculate days to expiry
    data['days_to_expiry'] = (data['Expiry'] - data.index).dt.days

    # IVP entry condition
    condition_1 = (data['IVP'] >= 50) & (data['IVP'] <= 95)
    # RSI entry condition
    condition_2 = (data['RSI'] > 40) & (data['RSI'] <= 65)

    # Generate signal as 1 when both conditions are true
    data['signal_rsi_ivp'] = np.where (condition_1 & condition_2, 1, np.nan)

    #Exit Conditions
    #signal_rsi_ivp column stores 0 when days_to_expiry is less than days_to_exit.
    #We will exit the trade if the net_premium on the given date crosses above the take-profit, below the stop-loss or at expiry.
    # Generate signal as 0 when days to expiry is less than days to exit before expiry
    data['signal_rsi_ivp'] = np.where(data.days_to_expiry <= days_to_exit, 0, data['signal_rsi_ivp'])

    # Get take profit signals
    data['signal_rsi_ivp'] = data.apply(lambda x: check_for_tp(x))
    # Get stop loss signals
    data['signal_rsi_ivp'] = data.apply(lambda x: check_for_sl(x))

    return data
def get_iron_condor(underlying_price, options_data):
'''
This function processes the input data for the underlying price and options. It calculates the at-the-money (ATM) strike price and establishes the first two legs (short positions) of an iron condor, positioned 10 points away from the ATM. Next, it computes the total premium from these short positions and rounds it to the nearest 5-point increment. This rounded premium, plus an additional 10 points, determines the distance from the ATM for the next two legs (long positions) of the iron condor. The output is a data frame that includes both the long positions (marked as 1) and short positions (marked as -1), along with their respective premiums.
'''
# Create a dataframe
iron_condor = pd.DataFrame(columns=[' Option Type', 'Strike Price', 'position', 'premium'])
# Calculate ATM strike price
atm_strike_price = 5 * (round(underlying_price / 5))
# Define how far out of the money are the first two legs from ATM strike price
short_options_dist = 10
# Setup initial two legs of iron condor
iron_condor.loc['0'] = ['CE', atm_strike_price + short_options_dist, -1, np.nan]
iron_condor.loc['1'] = ['PE', atm_strike_price - short_options_dist, -1, np.nan]
# Append respective premiums for the legs
iron_condor['premium'] = iron_condor.apply(
lambda r: get_premium(r, options_data), axis = 1)
# Define the price distance for next 2 legs of iron condor
total_short_premium = iron_condor.premium.sum()
total_short_premium_rounded_to_5_points = round(total_short_premium / 5) * 5
# Calculate the long options distance
long_options_dist = short_options_dist + total_short_premium_rounded_to_5_points
# Setup next two legs of iron condor
iron_condor.loc['2'] =['CE', atm_strike_price + long_options_dist, 1, np.nan]
iron_condor.loc['3'] = ['PE', atm_strike_price - long_options_dist, 1, np.nan]
# Append respective premiums for the legs
iron_condor['premium'] =iron_condor.apply(lambda r: get_premium(r, options_data), axis = 1)
return iron_condor6. Simulate Past Performance:
Test the algorithm against historical data to see how it would have performed in the past. This step is crucial for identifying any flaws in the strategy. Back-testing must include realistic trading conditions, such as transaction costs, slippage, and market impact. Constantly hunt for any look biases - look-ahead, survivorship, overfitting etc. The goal here is to replicate live market conditions to avoid any surprises during live implementation.
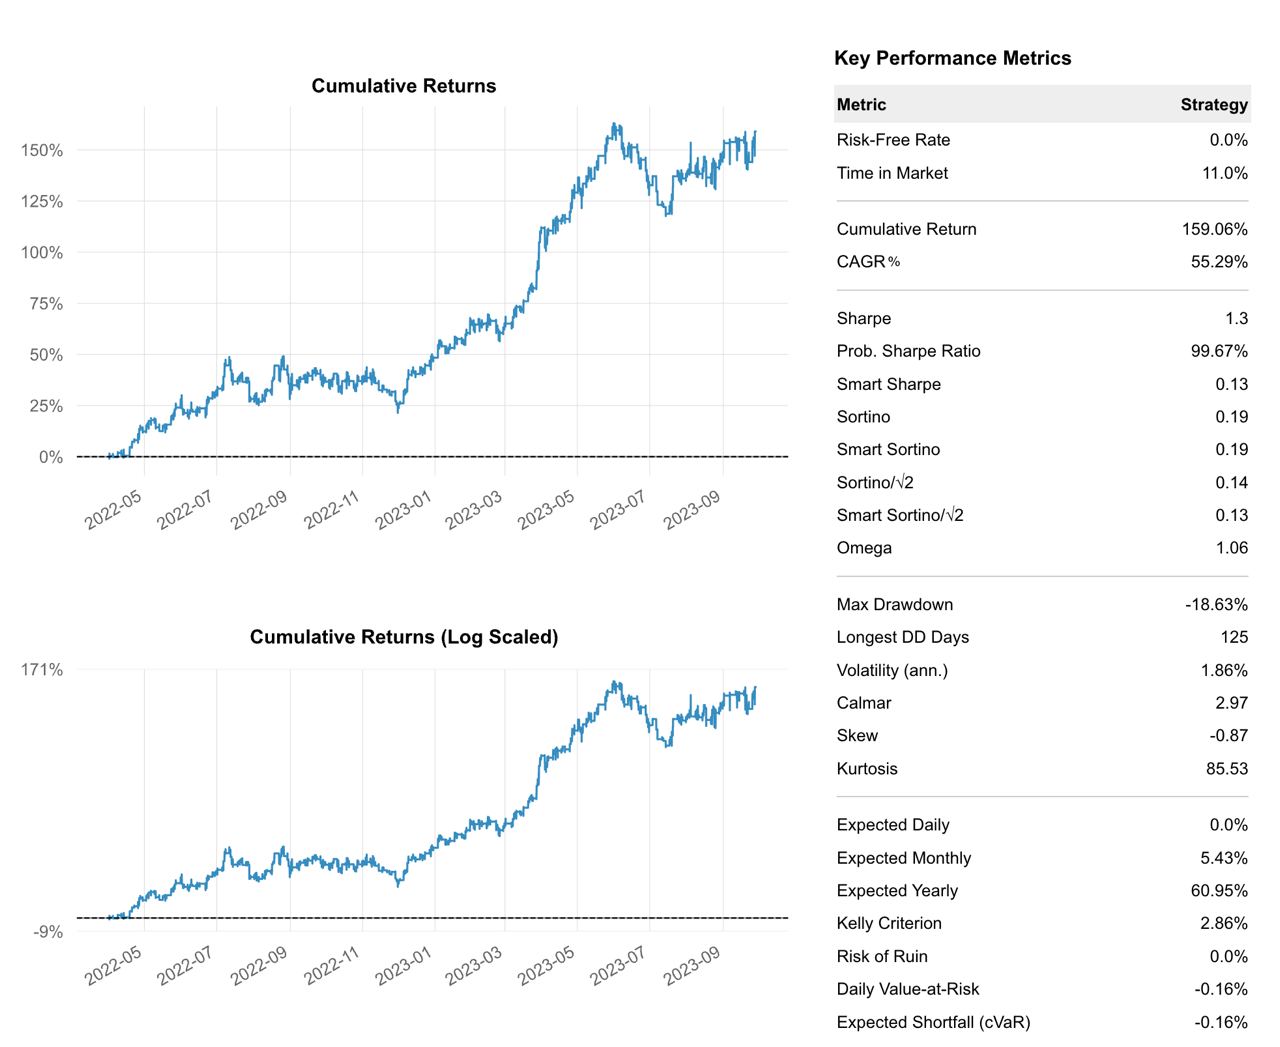
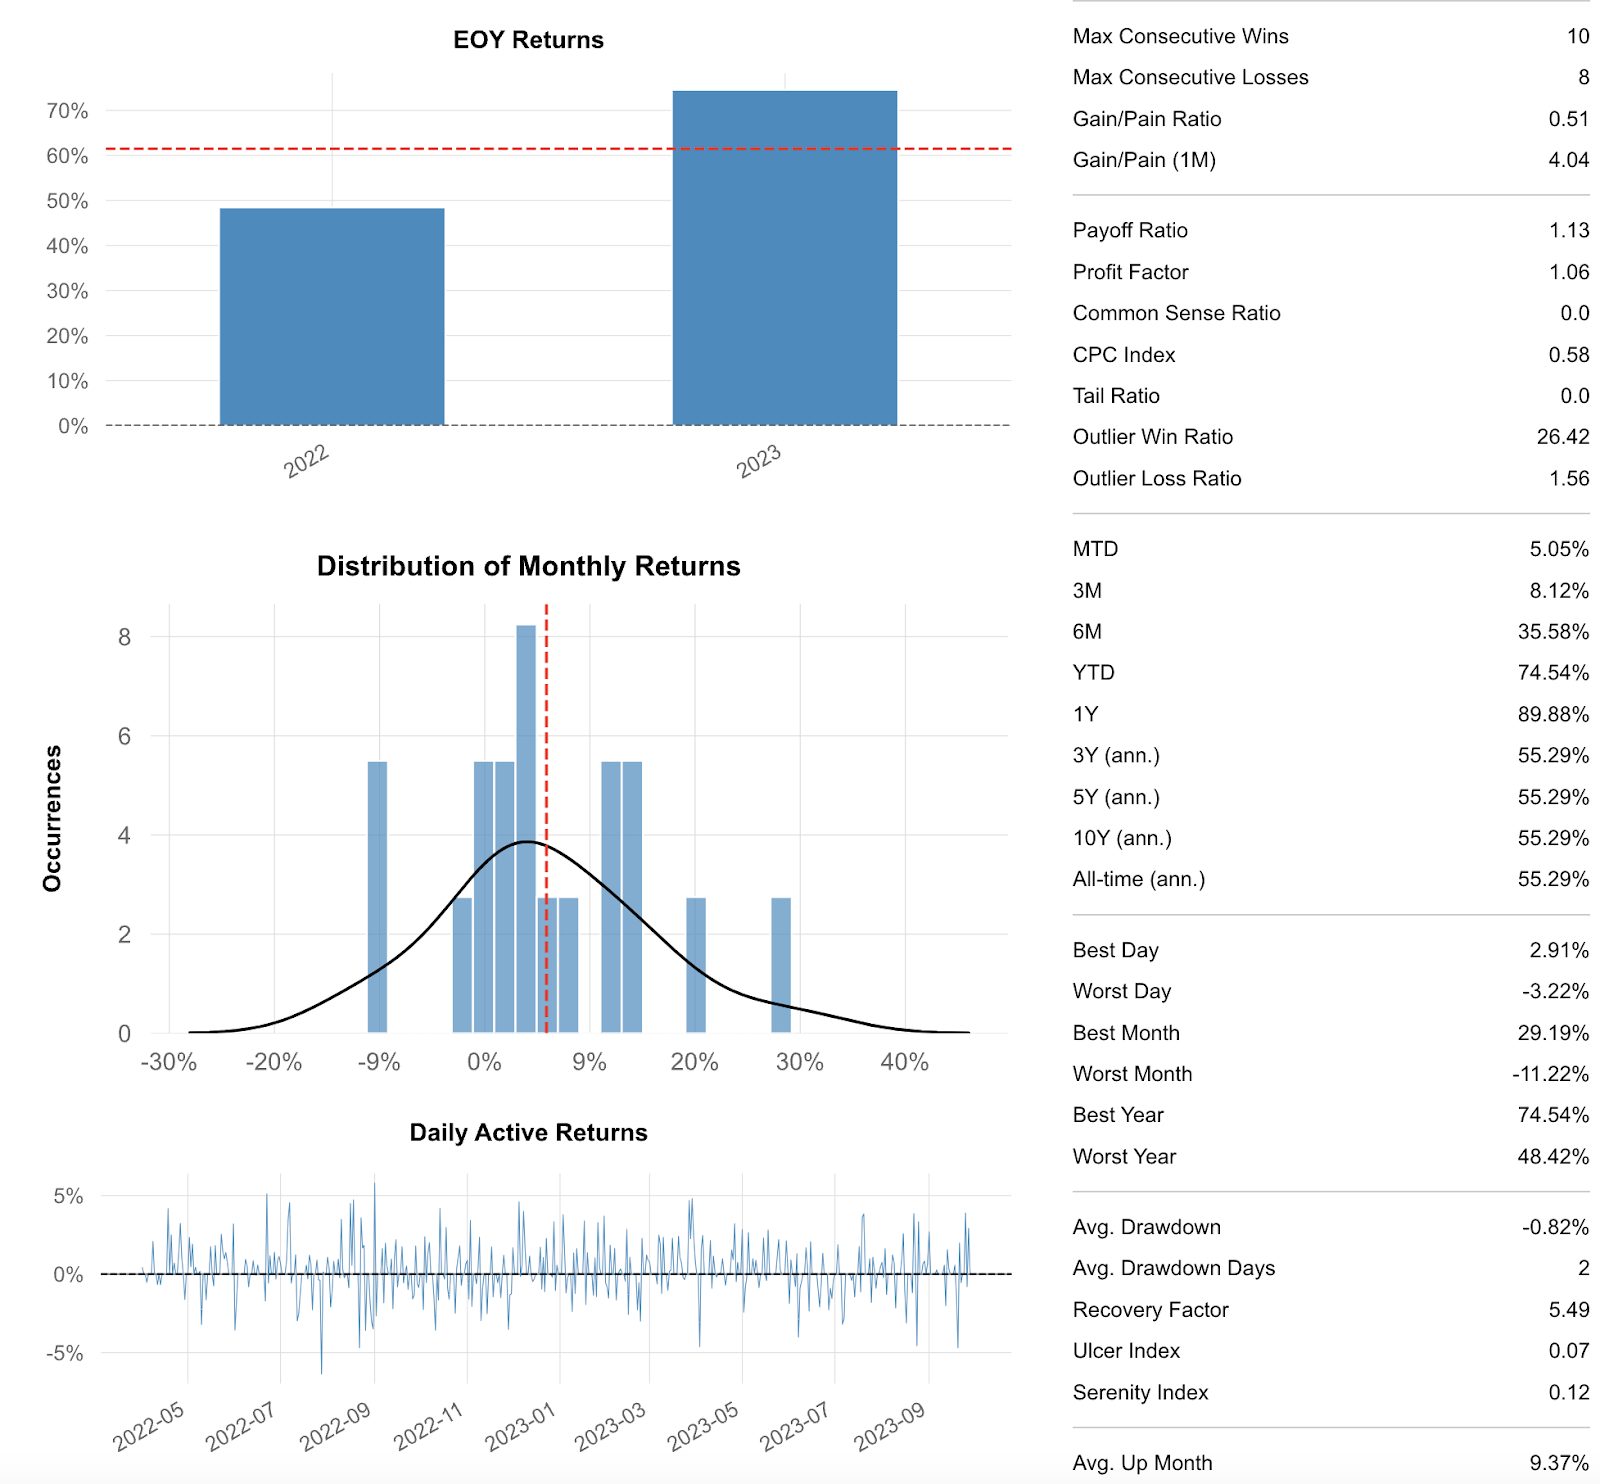
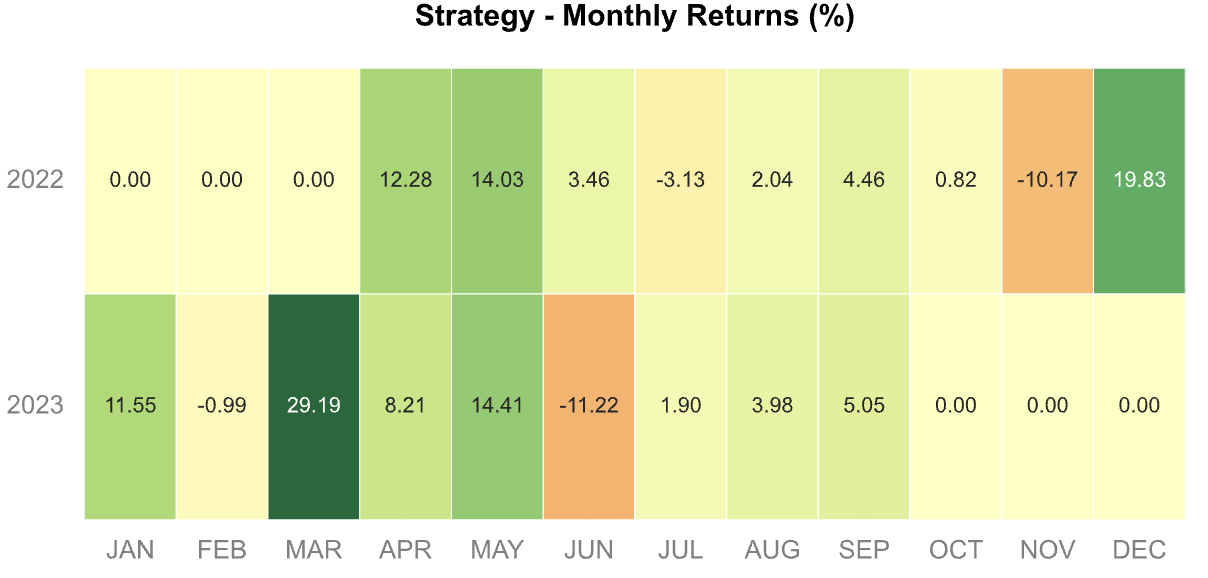
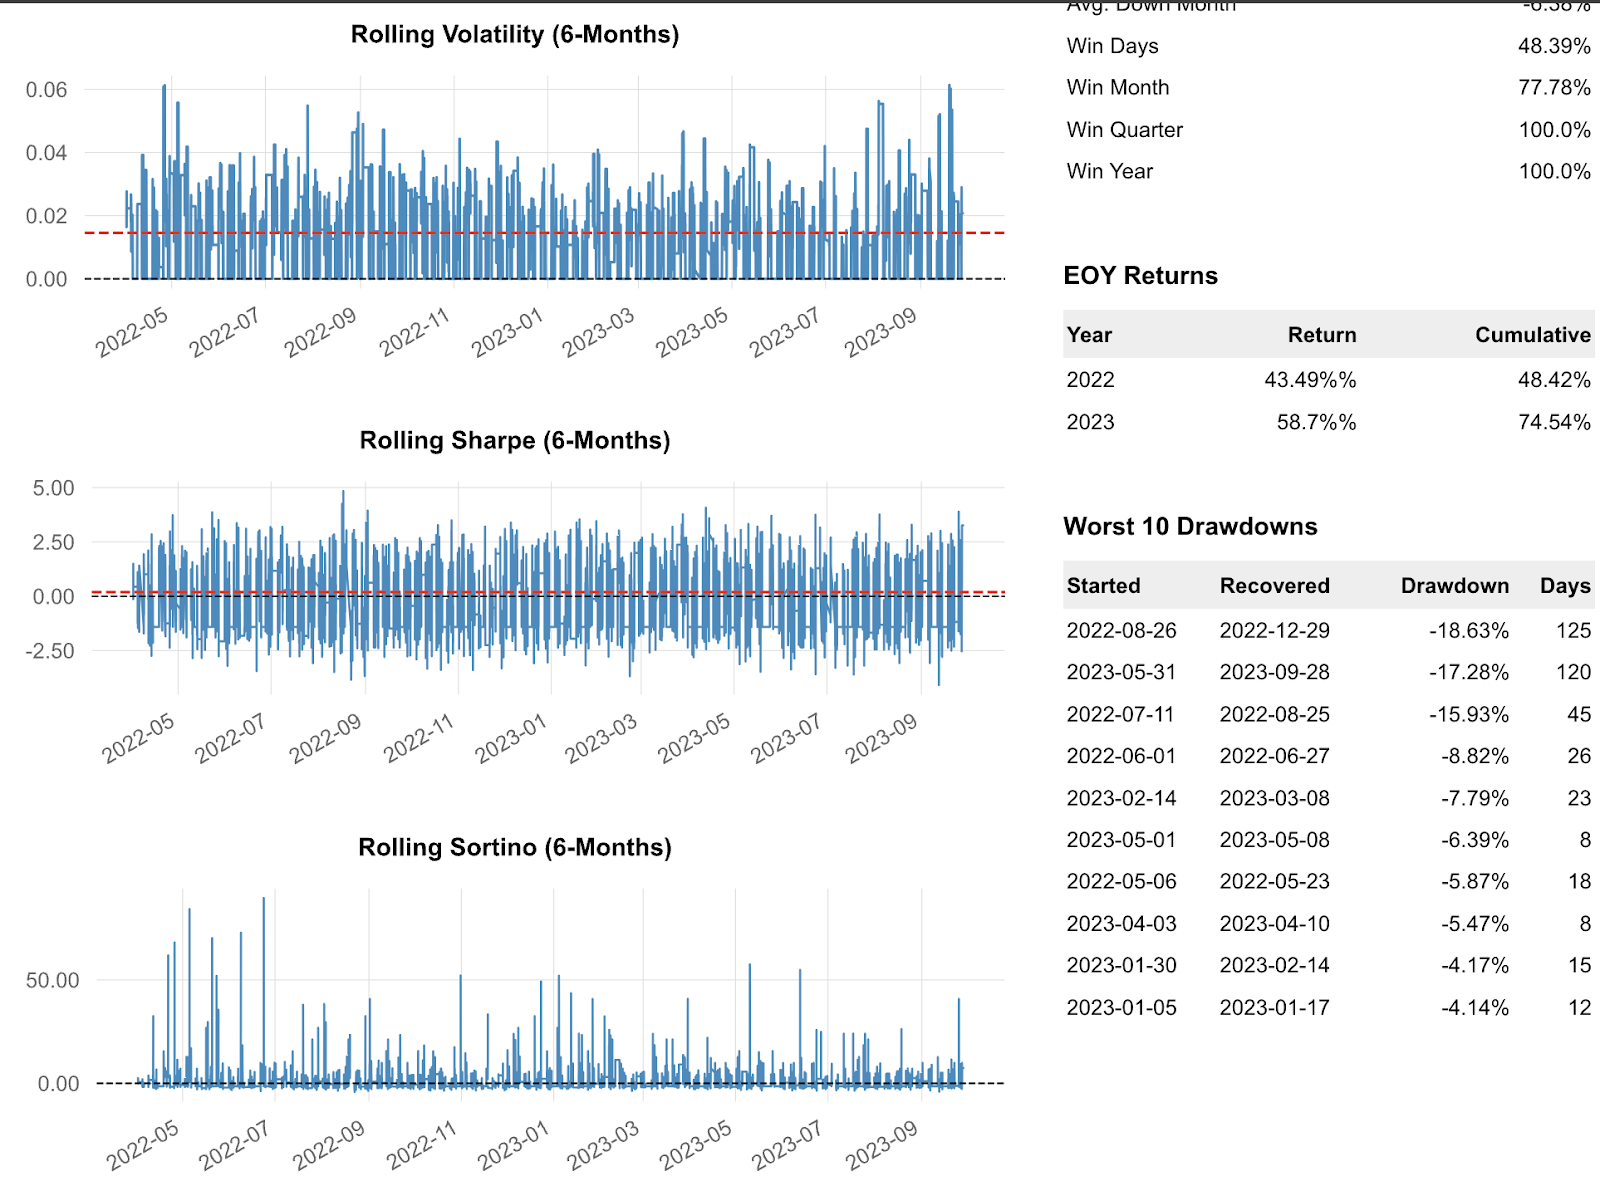
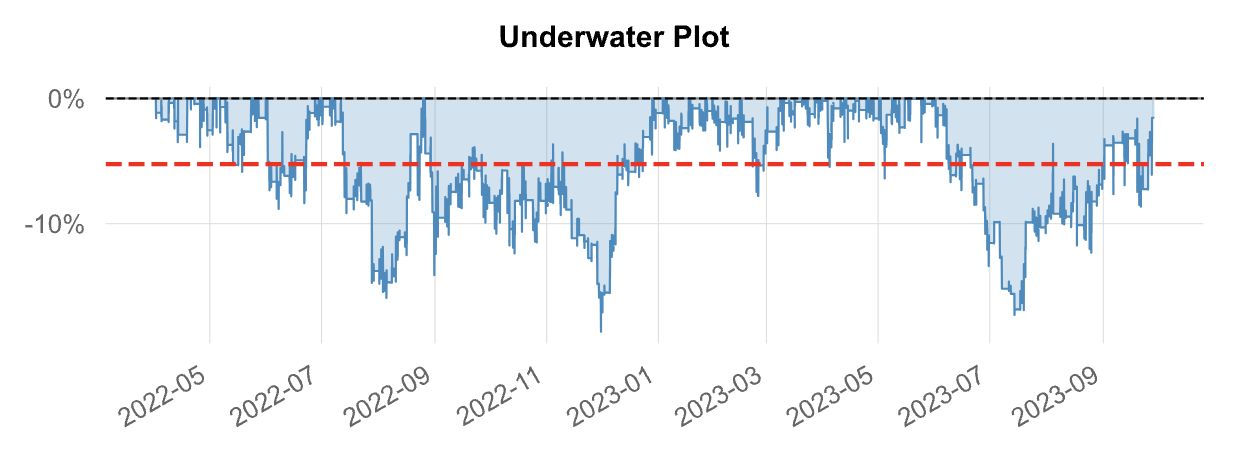
7. Strategy Evaluation:
Python, with libraries like Pandas, NumPy, and specialized packages like QuantStats or Pyfolio, provides robust tools to compute these metrics. These libraries can help in analyzing trading strategy performance, backtesting results, or portfolio analysis. Look at metrics like Total return, Annualised Returns, Drawdowns, and Performance ratios such as Sharpe, Calmar, MAR, Omega etc.
8. Optimization:
Tweak Parameters: We may adjust parameters like strike price distance, deltas, entry time, exit time, expiration period, take profit, stop loss, position sizing mechanism, and frequency of trading based on back-testing results. The key here is to avoid overfitting!
- Paper Trading (Forward Testing):
Integration with Trading Platform: Use an API to integrate your algorithm with a brokerage platform that supports options trading, like ours.
Real-time Testing: Before going live with real money, test the algorithm in real time with a simulated account. This will provide insight into how it performs under the current market.
Embrace Your Backtesting Advantage
Backtesting transforms speculation into preparation. By incorporating backtesting into your repertoire, you equip yourself with powerful tools to analyze, refine, and ultimately elevate your options trading game by stress-testing your ideas.
Don't wait for the market to show you what works but rather be proactive and build strategies that withstand its twists and turns. Embrace backtesting as a critical advantage in your trading arsenal, paving the way to becoming a more proficient and strategic trader.
In our next installment, we cover how you can build your algorithmic trading setup that suits your needs perfectly.
Options trading is not suitable for all investors due to its inherent high risk, which can potentially result in significant losses. Please read Characteristics and Risks of Standardized Options before investing in options.
Past hypothetical backtest results do not guarantee future returns, and actual results may vary from the analysis.
All investments involve risk and the past performance of a security, or financial product does not guarantee future results or returns. There is no guarantee that any investment strategy will achieve its objectives. Please note that diversification does not assure a profit, or protect against loss. There is always the potential of losing money when you invest in securities, or other financial products. Investors should consider their investment objectives and risks carefully before investing.
The content of this article is for general information only and is believed to be accurate as of posting date but may be subject to change. Alpaca does not provide investment, tax, or legal advice. Please consult your own independent advisor as to any investment, tax, or legal statements made herein.
The Paper Trading API is offered by AlpacaDB, Inc. and does not require real money or permit a user to conduct real transactions in the market. Providing use of the Paper Trading API is not an offer or solicitation to buy or sell securities, securities derivative or futures products of any kind, or any type of trading or investment advice, recommendation or strategy, given or in any manner endorsed by AlpacaDB, Inc. or any AlpacaDB, Inc. affiliate and the information made available through the Paper Trading API is not an offer or solicitation of any kind in any jurisdiction where AlpacaDB, Inc. or any AlpacaDB, Inc. affiliate (collectively, "Alpaca") is not authorized to do business.
Please note that the content is for informational purposes and is believed to be accurate as of posting date but may be subject to change. All screenshots are for illustrative purposes only.
Securities brokerage services are provided by Alpaca Securities LLC ("Alpaca Securities"), member FINRA/SIPC, a wholly-owned subsidiary of AlpacaDB, Inc. Technology and services are offered by AlpacaDB, Inc.
This is not an offer, solicitation of an offer, or advice to buy or sell securities or open a brokerage account in any jurisdiction where Alpaca Securities are not registered or licensed, as applicable.