Once you have an alpha-generating, statistically-significant strategy, it's time to perform walk-forward testing. Walk-forward testing uses live market data with a paper trading account -- paper trading is a virtual test account that doesn't use real money.
Hello, world! My name is Leo Smigel, and I write about "Analyzing what works in trading and investing" at analyzingalpha.com

In this two-part series, we're going to create an RSI stack strategy using Alpaca and Backtrader.
In part one, we'll cover connecting the Backtrader backtesting framework to the Alpaca API-first brokerage and load in data for multiple time frames.
In part two of the series, we're going to create an RSI stack indicator to determine if a security is overbought/oversold on multiple time frames.
If you're unfamiliar with either Backtrader or Alpaca, check out my favorite Python trading tools.
Contents
Get an API Key
Before you can start paper trading, you will need to create an account with Alpaca. Once you've created an account, go to your dashboard.
You'll need to generate both an `API Key Id` and a `Secret Key`. Please be aware that the `Secret Key` will disappear after you refresh or navigate away from your dashboard as it's only displayed once for security purposes.

Installation
Since we've covered it in a previous article, I'll assume you've already installed Backtrader using conda or pip. With your environment activated, install the alpaca-backtrader-api python library.
pip install alpaca-trade-api
Also, make sure the version of matplotlib is 3.2.2 as you will experience a plotting error if it is the current version of 3.3.0
The Strategy
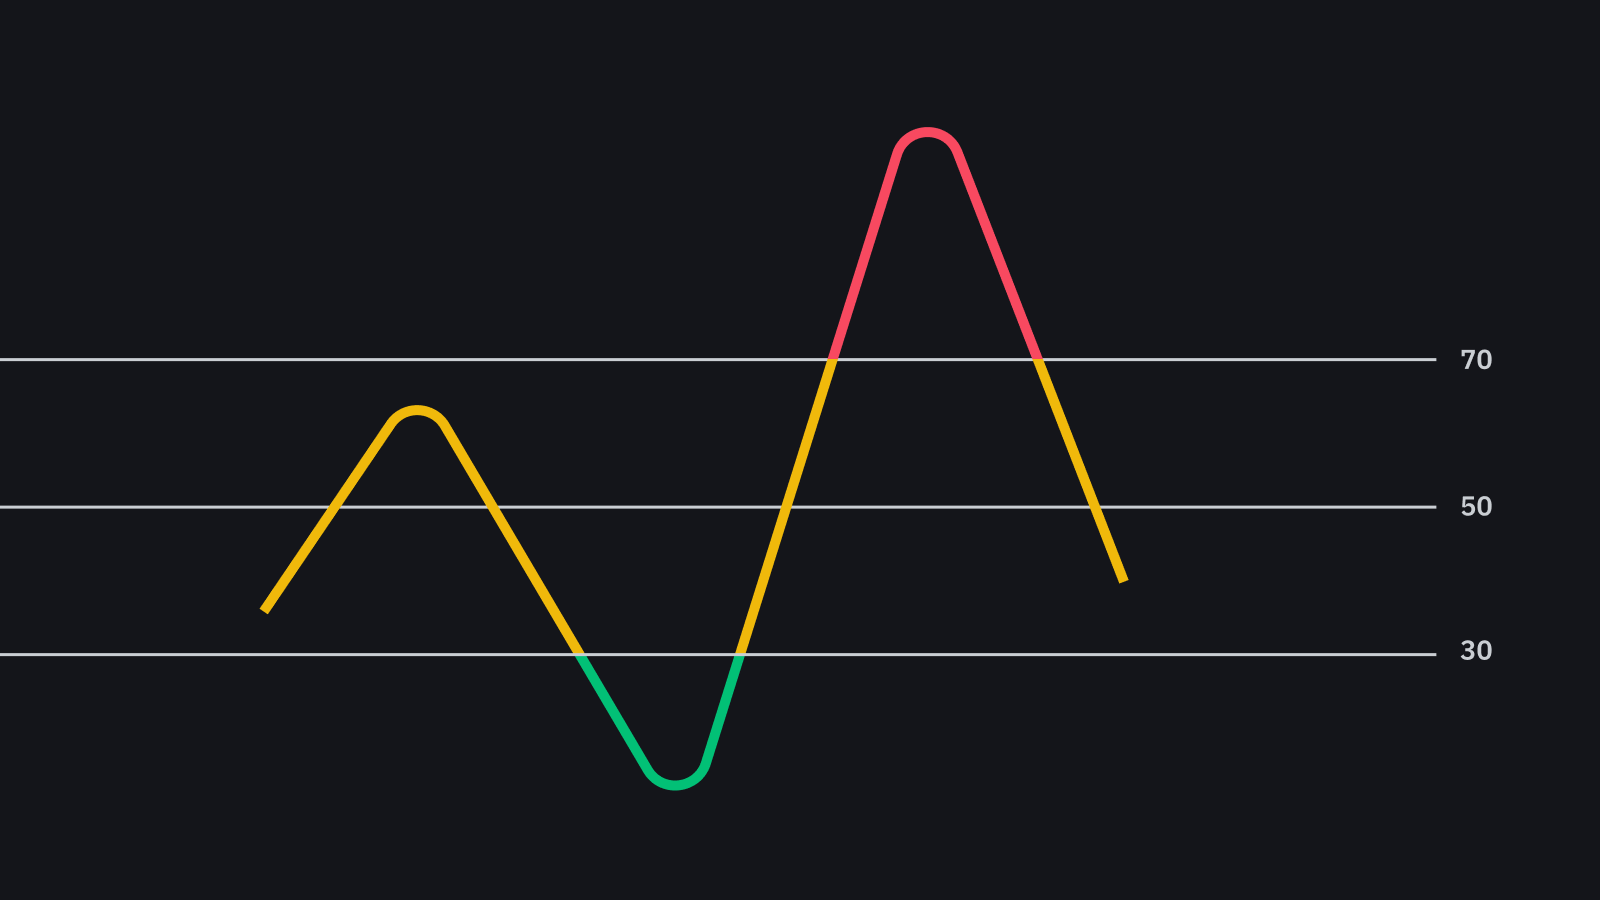
The relative strength indicator or RSI is a momentum indicator used in technical analysis. It's used to measure the magnitude of recent price changes to determine oversold and overbought conditions. Why do we care? RSI overbought/oversold entries are great bounce plays, especially if there is larger time frame support. If you're interested, you can read more about the RSI indicator.
/78480983-5bfc2b9cc9e77c0026b4fbfc.jpg)
Let's load and graph the data using multiple time frames.
I'll cover each significant section piece-by-piece. Additionally, all of the code will be available in the Analyzing Alpha GitHub Repo.
 leosmigel
Secure Your Credentials
It's never a good idea to place security information within code. It's even worse to place plaintext security credentials in code and then push it to a git repo. With this in mind, let's create a file called `local-settings.py` to store our api information and make sure that we add it to `.gitignore`. `local-settings.py` will need to be in the same directory as the `alpaca-backtrader.py`.
local-settings.py
alpaca_paper = {
    'api_key': 'YOUR_API_KEY',
    'api_secret': 'YOUR_API_SECRET',
}
Next, we'll create `alpaca-backtrader.py` and add our imports and API information.
alpaca-backtrader.py
import alpaca_backtrader_api as Alpaca
import backtrader as bt
import pytz
from datetime import datetime
from local_settings import alpaca_paper

ALPACA_KEY_ID = alpaca_paper['api_key']
ALPACA_SECRET_KEY = alpaca_paper['api_secret']
ALPACA_PAPER = True
Simple enough, right? Let's now add our dates, a ticker, and three time frames. Generally speaking, if you're day trading you'll be using the 15min, 30min, and hourly time frame; and if you're swing trading, you'll be using the hourly, 4-hour, and daily time frame.
Add Dates and Time Frames
fromdate = datetime(2020,8,5)
todate = datetime(2020,8,10)

tickers = ['SPY']
timeframes = {
    '15Min':15,
    '30Min':30,
    '1H':60,
}
Create the Strategy
Next up, we'll create our strategy class and initialize cerebro. For now, our goal is to load and understand our data. With this in mind, we'll print each line for each `next` and plot our selected time frame lines.
If the following code is unfamiliar, please read Getting Started with Backtrader.
 Leo Smigel
class RSIStack(bt.Strategy):

	def next(self):
    	for i in range(0,len(self.datas)):
        	print(f'{self.datas[i].datetime.datetime(ago=0)} \
        	{self.datas[i].p.dataname}: OHLC: \
              	o:{self.datas[i].open[0]} \
              	h:{self.datas[i].high[0]} \
              	l:{self.datas[i].low[0]} \
              	c:{self.datas[i].close[0]} \
              	v:{self.datas[i].volume[0]}' )

cerebro = bt.Cerebro()
cerebro.addstrategy(RSIStack)
cerebro.broker.setcash(100000)
cerebro.broker.setcommission(commission=0.0)
Add the Datastore
A store in backtrader is the interface with a broker. While the implementation for various brokers will be different, a store handles connectivity with the broker to access your account, orders, and positions; and provides access to data feeds from the broker. Additionally, if you're not happy with the implementation, you can expand on it or create your own store .
With that out of the way, let's create our store using `AlpacaStore` and create a `DataFactory`.
store = Alpaca.AlpacaStore(
    key_id=ALPACA_KEY_ID,
    secret_key=ALPACA_SECRET_KEY,
    paper=ALPACA_PAPER
)

if not ALPACA_PAPER:
    print(f"LIVE TRADING")
    broker = store.getbroker()
    cerebro.setbroker(broker)

DataFactory = store.getdata

for ticker in tickers:
    for timeframe, minutes in timeframes.items():
        print(f'Adding ticker {ticker} using {timeframe} timeframe at {minutes} minutes.')

        d = DataFactory(
            dataname=ticker,
            timeframe=bt.TimeFrame.Minutes,
            compression=minutes,
            fromdate=fromdate,
            todate=todate,
            historical=True)

        cerebro.adddata(d)
The `DataFactory` returns data that we can then add to backtrader. We loop through our list of tickers, which is just SPY in this case to make things easy to see when we plot, and our timeframes.
Running & Plotting
Now all that's left to do is to analyze the output. Let's check to make sure both our printed data and our plotted version make sense.
2020-08-06 14:00:00 SPY:OHLC: o:332.295 h:332.51 l:331.98 c:332.29 v:180462.0
2020-08-06 14:00:00 SPY:OHLC: o:332.295 h:332.61 l:331.98 c:332.51 v:270946.0
2020-08-06 14:00:00 SPY:OHLC: o:332.295 h:332.62 l:331.13 c:331.78 v:627680.0
2020-08-06 14:15:00 SPY:OHLC: o:332.29 h:332.61 l:332.18 c:332.51 v:90484.0
2020-08-06 14:00:00 SPY:OHLC: o:332.295 h:332.61 l:331.98 c:332.51 v:270946.0
2020-08-06 14:00:00 SPY:OHLC: o:332.295 h:332.62 l:331.13 c:331.78 v:627680.0
2020-08-06 14:30:00 SPY:OHLC: o:332.48 h:332.62 l:331.23 c:331.36 v:196294.0
2020-08-06 14:30:00 SPY:OHLC: o:332.48 h:332.62 l:331.13 c:331.78 v:356734.0
2020-08-06 14:00:00 SPY:OHLC: o:332.295 h:332.62 l:331.13 c:331.78 v:627680.0
2020-08-06 14:45:00 SPY:OHLC: o:331.39 h:331.81 l:331.13 c:331.78 v:160440.0
2020-08-06 14:30:00 SPY:OHLC: o:332.48 h:332.62 l:331.13 c:331.78 v:356734.0
2020-08-06 14:00:00 SPY:OHLC: o:332.295 h:332.62 l:331.13 c:331.78 v:627680.0
2020-08-06 15:00:00 SPY:OHLC: o:331.74 h:332.005 l:331.64 c:331.725 v:63096.0
Checking TradingView shows that the prices are accurate and all data falls within a penny. The first start datetime of the backtest is at 14:00 UTC and not 13:30 UTC. The reason for this is that we need to start on a timeframe where our lowest timeframe (hourly in this case) can create one full bar.
cerebro.run()
print("Final Portfolio Value: %.2f" % cerebro.broker.getvalue())
cerebro.plot(style='candlestick', barup='green', bardown='red')
The plot shows the same thing.

Analyzing the graph shows that everything is looking as it should.
Wrapping Up
If you made it this far, congratulations. You've created an Alpaca account, installed the Backtrader framework, and grabbed data from the `AlpacaStore` to create a multiple-timeframe trading strategy.
In part two of this series, which will be released next month, we're going to finish creating our RSI stack strategy and get you in a position to be able to create your very own algorithmic trading strategies.
In the meantime, feel free to head over to Analyzing Alpha to learn more about algorithmic trading and visit Alpaca to learn more about their fantastic API-first approach.
Once again all of the code will be available in the Analyzing Alpha GitHub Repo.
leosmigelThanks again for reading, and see you next month!
*Keep in mind that all investments involve risk and the past performance of a security or financial product does not guarantee future results or returns.
Follow @AlpacaHQ on Twitter!
Brokerage services are provided by Alpaca Securities LLC ("Alpaca"), member FINRA/SIPC, a wholly-owned subsidiary of AlpacaDB, Inc. Technology and services are offered by AlpacaDB, Inc.