Any opinions expressed are opinions of the host and their guests. Alpaca Securities LLC does not recommend any specific investments or investment strategies.
TL;DR
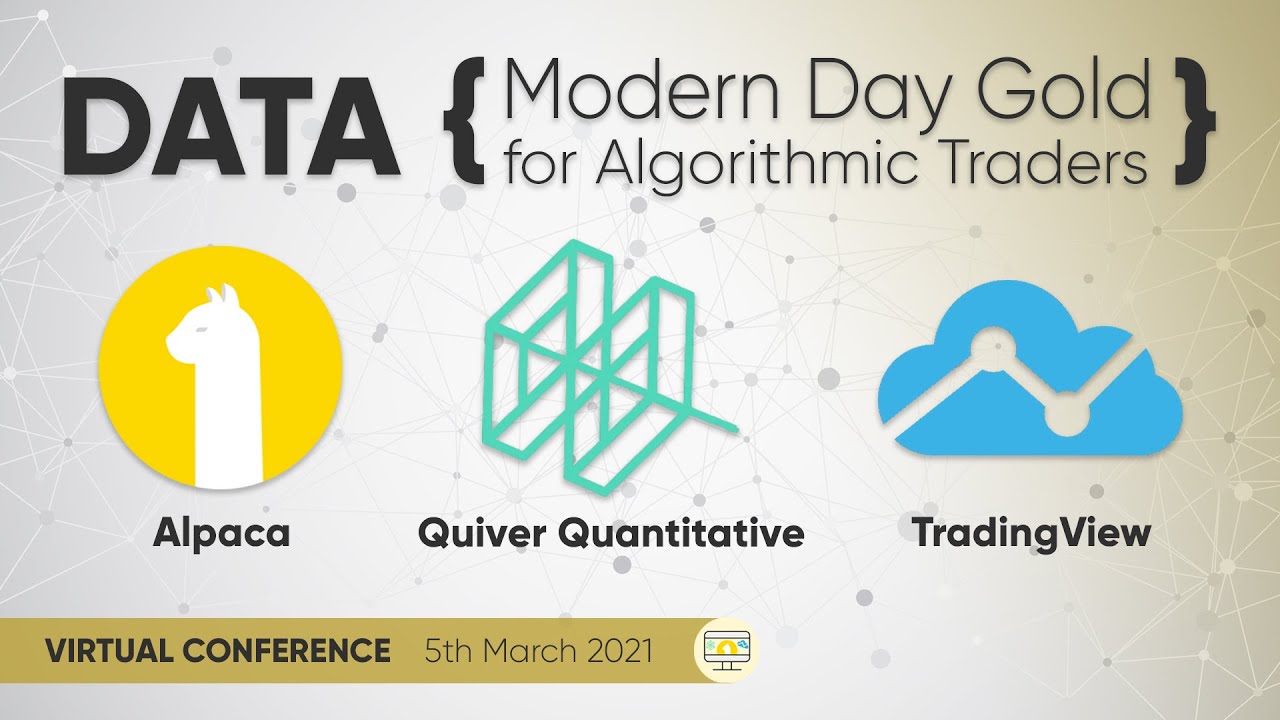
The Alpaca team hosted our second virtual conference "Data: Modern Day Gold for Algorithmic Traders" on March 5th, 2021. Along with our friends at Quiver Quantitative and TradingView, the conference focused on the different types of data available to traders and developers along with examples of how one can integrate these into their trading algorithm.
Summary
Data: Modern Day Gold for Algorithmic Traders occurred on Friday, March 5th featuring an amazing lineup of keynote speakers. Our conference began with Yoshi Yokokawa and Jason Bohne from Alpaca who gave a talk on “Exchange to Algorithm: Implementing Market Data to Trade”. Following that we were incredibly lucky to have both James Kardatzke and Christopher Kardatzke from Quiver Quantitative discuss “From WallStreetBets to Tracking Jets: Implementing Alternative Data into your Trading Algorithm”. Last but certainly not least we featured Pierce Crosby of TradingView host a live stream, “Exploring the TradingView Environment”.
Find the full transcript below. The recording of the entire conference can be found on our YouTube Channel

Full Transcript
Jason: Welcome to Data Modern Day Gold for Algorithmic Traders, a virtual conference, featuring Alpaca, Quiver Quantitative, and TradingView. We have a lot of really exciting presentations today featuring a variety of speakers and topics. I really can't wait to get started. So our guests for today are going to include Yoshi CEO of Alpaca, myself, the event director of Alpaca, James and Chris, the respective CEO and CTO of Quiver Quantitative. And Pierce the general manager of TradingView. If you're interested, you can see the respective websites are listed below under the PowerPoint.
Our schedule for today, we're starting at 11:00 AM Eastern, and we're going to have an introduction at 1105. We're having a talk between Yoshi and myself, focusing on market data at 11:25 AM. Eastern James and Chris take over speaking on alternative data, the integration with Quiver Quantitative specifically with an algorithm focusing on Reddit. At 11:55 AM. We're going to have a five-minute break shortly, followed at 12:00 PM. Eastern. We're going to have Pierce the general manager of TradingView explore the TradingView environment via live stream. At 1230. We're going to go through our closing remarks and contact information. But before we start, we have a surprise at the end. So all of our attendees stay tuned because we have something pretty, pretty cool at the end. So that being said, let's start off between Yoshi and me,
Exchange to algorithm implementing market data to trade Yoshi is experiencing some internet connectivity issues. So I'm going to, I'm going to take over, for now, Alpaca, Securities, LLC. We are a FINRA member, an SEC, registered US broker-dealer with a commission-free stock trading API. On the right-hand side, you can see our main website, which features trading integrations, working with us and the community.
As we offer an inclusive API with SDKs in Python NET C-sharp Go Node and many, many other languages we are for both the developers and the traders. Including our OAuth 2.0 integration. It allows you to build apps of front ends off of alpacas API. We also have a vibrant and growing community of over 80,000 members to date. Something interesting you might've noticed if you're keeping up with the community is fractional trading is now enabled for everyone. The Alpaca community is one of the fastest-growing communities of developers and traders today. We have users from all across the world, spanning interests and backgrounds, even more, diverse in that. You can engage with us through the Alpaca community Slack.
You can learn with us with Alpaca resources, Contribute with GitHub, Discuss ideas with other community members via our forum. Stay updated with the most recent product updates and features through our Twitter and stay informed with general market news and resources from all of our pre-mentioned categories in our weekly newsletter.
Let's start talking about market data, a lot of market data originates at the exchanges. Now a lot of people might be familiar with what a stock exchange is, but it would help to really discuss all the technicalities behind them. So exchanges are regulated centralized markets for buyers and sellers to trade securities.
While there are over 15 U S exchanges by market capitalization the largest stock exchanges are the New York stock exchange shown on your right and NASDAQ, which is tech-focused. Some interesting facts are the New York stock exchange is one of the oldest exchanges and NASDAQ is more tech-focused with first created in the 1970s.
Something I found quite interesting exchanges can be classified as either dealer or auction markets. Now, what's the difference you might ask. Okay. So a dealer market is when transactions happen through a dealer. NASDAQ is a good example of this. So prices are set by the dealer who usually acts as a market maker in between.
Okay. So like what's different than from an auction market. Okay, cool. Well, transactions happen between participants in an auction market like the New York stock exchange and the prices aren't set by the market maker or the dealer. The prices are set by the auction method with opening and closing auctions.
You might've noticed specific order types, such as the market on open official. These order types usually work with open and closing auctions, some common exchanges CBOE, New York Stock Exchange, NASDAQ. A lot of the exchanges, most people are aware of. But there are some interesting exchanges that people might not be aware of, such as FINRA, ADF, Long-Term stock exchange, Members Exchange.
It's important. I think, to be aware of all the different regional exchanges, in addition to the major exchanges, if you're really looking into different market data and the origins of said market data. Consolidated Market feeds. Okay, great. So we know data originates at the exchanges, but what's the next step?
So the SEC established the national market system in the 1970s for trading securities, the consolidated tape association known as CTA, and unlisted trading privileges UTP for short specify the process for data collection, aggregation, and distribution, both the CTA and the UTP outline the exact procedures for quotes and trades, which are responsible for processing and consolidating the data.
Now they're commonly known as sip data feeds. Now the sips provide the actual data feed for us markets along with important regulatory information, national best bid, and offer NBBO for short, you might've seen this. If you're looking into NBBO quotes, limit up and limit down, it's important to note though that the sips are the actual processors that are responsible for distributing the data from the exchanges to the next step.
So the CTA is administered by the security industry automation corporation, which is a part of the New York stock exchange. Now they're responsible for the real-time trades and quotes from New York stock exchange-listed stocks, which are classified as tape A and stocks from your American exchanges, which are classified as tape B.
Now the CTA capacity for quote feed is 950,000 every hundred milliseconds abbreviated by the CQS or consolidated quote system. The CTA capacity for trade feed is 350,000 every hundred milliseconds consolidated trade system is abbreviated right next to that, and we've included the source. If that's something of interest.
Now, the other plan is the unlisted trading privileges. Now, this is administered by NASDAQ, which is responsible for real-time trade and quotes from the NASDAQ listed stocks classified as tape C. Now the UTP capacity for quote feed is 1 million, 290,000, every hundred milliseconds. And the UTP peak capacity for trade feed is 1 million, 330,000 every hundred milliseconds.
So it's quite revolutionary how much data can be compressed and distributed. And so I find this interesting. Okay. So I included a graphic to kind of visually explain everything we went over so far. We have our self-regulatory organizations. It's like the New York stock exchange NASDAQ along with the equity data plans and the CTA the UTP plan.
We've also included the respective tape for each self-regulatory organization, along with the data centers, which are located in New Jersey. A lot of users might've heard of trade conditions, quote, condition, sales conditions, and some like to be curious, like what, what do these conditions actually mean? Both the CTS, the consolidated trade system, along with the UTP data trade data feed has specific conditions such as odd-lot trades, contingent trades, market center, official open, and every trade that happens is marked with the conditions underlying that trade.
For instance, odd lots of trades that don't happen in the quantity of a hundred shares, UTP trade data, feed, have similar trade conditions specific for that plan. Somewhat similar to trade conditions, except the conditions are different, but the same underlying idea that every quote that exists has specific conditions associated with that quote, such as opening quote, closing, quote, an on-demand intraday auction.
These quote conditions can be found along with the trade conditions and the plans, the CTA, and the UTP plans. They're somewhat dense, but I definitely wanted to include them just for reference as we will be distributing the slides. We went over trades we went over quotes. Cool. What are the next step bars? A lot of people use a bar when they're building a trading algorithm.
Now aggregate bars have common time frames of one minute, five minutes, 15 minutes, one day and common properties, you know, O H L C V, which is abbreviated for open high, low, close volume, along with VWAP. However, you're not restricted to using these specific timeframes for bars or even time-measured bars.
Tick bars are common. Dollar bars are somewhat common. Volume bars are common, but sticking to time bars, you could have a 12-minute bar. You can have a 19-minute bar. You could have a three-hour bar. Okay. Cool. You might ask how do you exactly aggregate your own bars? Like how do you self aggregate now there are specific sales conditions?
You need to be aware of if you're aggregating your own bars from the tick data of the trades. Now, again, these conditions are somewhat dense and it's a matrix of possibilities as you get conditions of conditions, but there are all specified in the CTA and the UTP plan. Now some conditions that could affect is whether a trade was sold last, if it was a market center on opening, if it was a market center official open, or if it was the next day trade. However, this list is by no means extensive. It's a very, very complicated system and the exact possibilities are listed in the manual.
Usually, market data providers can be classified as one of the following, you know, exchanges, Market Data APIs, third-party software providers.
This is why you might hear of people having their data feeds going straight from the exchange. But if we're just looking at market data API, some standard ones could be IEX cloud, Alpha Vantage Polygon, Tiingo. These are all quite common in the industry. Definitely not an extensive list. However, common features for market data providers could consist of WebSocket streaming for real-time.
Trades quotes, bars, REST API for historical trades, quotes, and bars, along with the property of getting the last trade slash quote endpoints for stock splits, dividends, financial news, and broad market versus stock-specific research. As if you want to get a snapshot of the market. So we're currently in public beta and that consists of real-time and historical price data.
We have access to five years of historical trades, quotes, and bars, along with WebSockets streaming for said trades quotes and minute bars. They are direct feeds from the CTA administered by the New York stock exchange and UTP administered by NASDAQ. As we discussed commonly known as sip data feeds and together, it offers a hundred percent of market volume and we have basic and pro plans for users of all levels.
So as we're wrapping up Alpaca's presentation today, I hope everyone got a little bit of an insight into how data goes from the exchange all the way to the end-user. It definitely is very complicated, but I think it's definitely important if you want to understand the process and perhaps the reasoning for why specific instances occur in your data.
So that being said, I'm going to transition it to James and Chris from Quiver Quantitative, who will be talking about alternative data specifically with the implementation of Reddit.
[00:12:21] James: Hi, I'm James Kardatzke. I'm the CEO of Quiver Quantitative. And I'll be presenting alongside my twin brother and co-founder and CTO, Chris Kardatzke. So I guess in today's presentation, we're just going to give you a quick introduction to alternative data and talk a little bit about why it's a very relevant tool right now, and why it can provide you with some alpha-generating insights to help you improve your trading strategies.
We're gonna talk a little bit more about what we've been building at Quiver Quantitative and what we're doing to make alternative data more accessible. And then Chris is going to walk you through a brief case study showing how to backtest a simple WallStreetBets trading strategy, using data derived from our API specifically looking at what a trading strategy that selected the top most discussed stocks on WallStreetBets every week would look like, how to implement that, and then he's going to share a little bit of results just from that simple backtest. And finally, we're going to open it up for about 10 minutes of Q and A to answer any questions that you guys may have about our presentation.
So if you look at the picture, you can see a little bit of our backgrounds. As you can see, I'm a bit more heavy on the finance and economics side of things. Chris is a bit heavy on data science and statistics. Both of us are really passionate about investing and passionate about data science and programming, but what else that really inspired us to found Quiver Quantitative was an internship I had at Adage capital last winter when I was working there, I really got my first exposure to alternative data.
And at first, saw how useful it was to professional investors and how important it was as part of their investment decision-making process. So just a quick introduction for those of you who may not be familiar with alternative data its term basically refers to anything outside of traditional financial data sources.
So for example, instead of looking at income statements, balance sheets, price movement, it could be looking at how a company's social media following changes over time. It could even be looking at how many companies or how many cars are parked in different companies parking lots to try to predict what their future earnings are gonna look like.
So you can imagine there's like all these data sets out there that are super useful for thinking about how a company is performing what their price movement might do in the future. That historically just was not used, I guess as nobody would tap into these data sources, big data wasn't really as common as it is today.
So only within the last decade or so has alternative data really started to take off and make it, you know, to be a big part of the hedge fund industry and the investing industry across the board, not just like a small selection of quant funds, but really it's being used at, you know, almost all the big hedge funds right now.
And even I guess, many of the smaller funds as well, and even like fundamental shops where people traditionally may not do super heavy data analytics work, alternative data is really starting to kind of take over the industry. So you can see that $2 billion was spent on alternative data last year.
The number has been growing about 60% year over year. So obviously it's, it's growing very quickly and what's even more interesting is that a lot of these datasets are often not particularly difficult to understand. During my time at Adage, I saw that a lot of data, the data sets that we're using didn't really require a deep financial background, or even like a deep data analytics background to understand and make use of and find unique insights from.
So in many ways, I thought that these alternative data sets could be just as useful for people outside of the institutional space, as they obviously were for people you know, on wall street. However, as you can see in the graph on the right here, most alternative data sets are currently priced for tens of thousands of dollars a year.
That just makes them completely inaccessible to anybody who doesn't have a million-dollar, a hundred thousand dollars budget to spend on data every year. So for anyone who's not managing a billion-dollar book, not managing hundreds of millions of dollars. Alternative data has been until very recently. I think then, you know, just completely inaccessible and it's been really hard for anyone in the retail space to kind of tap into some of these alternative data sets that have really taken off recently.
So that was our main inspiration and the main reason we wanted to create Quiver Quantitative and our mission really here is to bridge this data gap between individual investors and wall street. And we want to make sure that everyone is getting access to these alternative datasets that are obviously very useful and very useful for generating unique investment insights.
So the first step, I guess, that we took in order to kind of accomplish this goal and make alternative data more accessible was we had to go out and actually start scraping these datasets and start collecting the data for ourselves. So you can see here's the list of all the data sets that we currently are scraping and aggregating.
When we first founded the company last year, we started with about six of these. Since then we've been adding about one or two new data sets to our platform every month. And we look to continue doing that in the future. So you can expect this list to grow over time. But in general, we kind of divide our data sets up into three major classes.
On the left here, you can see, first of all, we look at several consumer interest data sets just to track what people are talking about what retail investors might be interested in. For example, this, WallStreetBets discussion dataset, which Chris will be touching on a bit more later. We think it provides a really great look into what retail investors may be really passionate about, you know, help people kind of spot the next GameStop situation before it occurs.
We also look at Wikipedia page views to see which companies are getting the most interest from people just, you know, via Wikipedia searches. We track corporate Twitter follower counts over time. And then we also look at stack overflow discussion; we track discussion on the SPAC subreddit. And then we also look at discussion of hacker news.
So all these datasets, just trying to get a look at what you know, consumers, and what retail investors might be interested in talking about. So in the middle here, you can see that in the second set of datasets, we have, we do a lot of work collecting data from government agencies and also looking at datasets that pertain to politics.
And just what's, you know, the inner workings of our government. So you can see at the top here, we have datasets looking at personal stock transactions by US senators and representatives just for the last election cycle. We came up with a new metric called political beta. That is basically a way of estimating how each company is going to be affected by different political outcomes.
So for example, you could see which companies were most likely to perform well if Biden won, versus which companies were most likely to perform well if Trump won. And, you know, obviously, this is a good tool, not only to kind of manage your exposure to certain political outcomes. But also we know that a lot of our users felt very strongly about how the election might turn out.
So, it just provides another way that you can kind of craft a trading strategy around this you know, alternative dataset. So in addition to that, we also look at different violations and fines that are being assessed to publicly traded companies. We look at government contracts to see who's being awarded money from different government agencies.
We track corporate lobbying. We look at product recalls. We do some work with patent data. And then also, of course, we've been tracking the progress of different COVID-19 clinical trials. Separately for the last dataset, which is a small collection of ESG data sets we've been working with first one of these, the corporate jet tracking is very interesting, this is a data set that's been used by hedge funds for several years now.
And it definitely has a lot more, I guess, qualitative applications versus quantitative often hedge fund analysts will study corporate private jet flight logs, basically to see where company planes are taking off from and landing as this can often be a good way to predict future partnerships can be a good way to predict potential you know, M&A activity or potential future investments.
And a good example of this is a couple of years ago, there's a company called Occidental petroleum that had a corporate jet that flew from their corporate headquarters into Omaha, Nebraska. And this tipped off a lot of hedge fund analysts that potentially an investment from Berkshire Hathaway could be coming.
So there was a lot of buying activity in the company. And then just a couple of days later, it was announced that Warren Buffett was going to be taking a stake in Occidental so it's sent the stock price up like five or 10% or something like that. So just a super interesting dataset with, you know, I guess a lot of interesting applications, but obviously not quite as quantitatively focused as some of the other stuff we have here, we also track H1B work visas to see which companies may be expanding or contracting their workforce.
We look at CEO compensation, insider trading, shared ownership between companies, and then we also track facility emissions. So here's just, I guess this is just the collection of data sets that we are currently scraping/ aggregating. But like I said earlier, we're always continuing to add new data sets to our platform.
So you can expect that we'll, you know, we'll be adding more to this list as time goes on. And I should also note that we're always open to suggestions on what data sets that you find interesting. and like to see added to our site. I think our contact information is on the last slide. So definitely feel free to reach out if you see any alternative data sets out there that you'd like to be able to get access to and that you think might be a good fit for our platform.
So the next step is, you know, after scraping /aggregating this data, we want to present it in a way where it's really usable for people and really easy for everyone across the spectrum. From retail investors to hedge fund professionals, to be able to easily extract insights from these data sets. So, that's the main goal of our web platform, which is found at www dot quiverquant.com.
This is a completely free platform. You can go there right now, you know, create an account. There'll be no charge. And we basically provide two different ways of finding insights and kind of tapping into these data sets that we're scraping. The first you can see here on the right, we let you view data by ticker.
So if you already have an idea of a company that you're considering investing in maybe you just want to do a bit more research into a company, make sure that you're not overlooking anything. We let our users do a ticker search, and then they can immediately see a selection from a lot of these different alternative data sets that we're scraping for that company.
Just to kind of give a holistic view of everything that we're collecting for that particular name. On the other hand, there's a lot of people who come to our platform and maybe they don't have a specific idea of a company they want to invest in, or maybe they're just really passionate about a specific data set and, you know, want to generate some ideas based on how they feel about you know, one of the topics that we cover.
So for that, we also have different data dashboards for each of the sources that we're scraping from. And this makes it really easy to quickly pick out kinds of winners and losers within that specific dataset. So you can see an example here on the right. This is our WallStreetBets data dashboard.
You can see it's, you know, we have just had a chart there showing which companies have been mentioned the most on WallStreetBets over the last 24 hours. We also let you do a search to see for a specific company, how its mentions have trended over time. So with our data dashboards, we're really trying to aggregate everything for a specific data source into one place and then make it really easy for people to quickly pull insights from that.
So in addition to the web platform, we also wanted to give people the tools that allow them to do kind of a deeper dive into the data sets, and then also integrate any of our data feeds into their own projects or their own products. If that's something that they're interested in. So the quiver API was just launched last October.
And what we're looking to do here is, first of all, we'd like to start partnering with trading platforms, financial news providers, and then other enterprises so that they can tie alternative data feeds into their own products. Just in general, you know, this ties into our mission very strongly, but we'd like our alternative data set to be, you know, reach as wide an audience as possible, and we really want to make it so that everyone has access to a lot of these alternative data feeds. So through our quiver API, anyone who's interested in building a project or building something on top of our you know, data feeds it's very easy to do so we can easily work out licensing agreements where they can tie the data feeds directly into what they're working on.
And the quiver API also allows anyone to do deeper analysis on these feeds for themselves. So what, the platform is nice for is like point insights and stuff, and, you know, quickly visualizing the data set, but it doesn't really provide the capabilities for someone to do deep research or analysis on the data sets that we're scraping.
So with the API, you can tie into the full historical data feeds. We've gathered you know, download all of that data under your own, in your own programs. And then kind of do your own deep analysis on top of that. And then finally, also, if you'd like to execute live trading strategies, it's very simple to tie our data feeds into Python into any programming language of your choice.
And then start doing backtesting and start executing trading strategies. On top of that, this is something that my brother is going to be talking on in just a little bit, but with just a few lines of code, it's very easy to pull one of our data feeds basically into your own scripts. So as you can see right here, we have a pretty simple pricing model for any individuals or, you know, people outside of the commercial setting who want to access our API.
And just a few minutes, it's easy to get set up and start tying into these data feeds directly. So with that, I'm going to turn it over to my brother who's going to be talking a bit more about a specific case study of how you can use the quiver API to backtest the simple trading strategy on top of our WallStreetBets discussion dataset.
[00:24:44] Chris: Yeah, thanks, James. So I just wanted to give you guys kind of a simple example of something that could be done with one of our data sets. And with all the news of WallStreetBets recently, I decided that would be a good choice to show just kind of a simple piece of analysis. And the goal here is going to be to backtest a trading strategy, which is built around which tickers are being mentioned the most out of WallStreetBets.
First, I guess I'll give you guys some summary statistics of the datasets. So basically what we're tracking with our WallStreetBets dataset is ticker mentions. So we post through tons of WallStreetBets comments, and we extract mentions of specific tickers. And you can see we've had, we've collected 3.3 million of these ticker mentions going back to 2018.
And that's the number which is growing pretty exponentially. We had collected about 250,000 mentions from 2019 2.1 million in 2020. And we already have collected almost a million in 2021. Many of those being GameStop. You can see below is a graph of the daily ticker mentions we've collected.
And then at the bottom, we also collect some sentiment data. So collecting data on stuff like mentions of calls and puts as well as some other sentiment measures. And you can see that the sentiment of the subreddit has genuinely been bullish over that period that we've collected data from. So here is the strategy: it's really simple. The goal is to get data on the previous week's WallStreetBets discussion.
And that's done using our quiver API. And I'll show you guys the code for doing that. It's really simple. It's just a few lines of code. And then identify the five most mentioned stocks from that data buying those stocks that started the trading week and sizing the positions based on how much they were talked about in proportion to each other.
And then selling the positions at the end of the trading week and then repeating. So basically just weekly rebalancing a portfolio based on which stocks we've talked about the most over the past week. So really simple strategy we are trying to kind of see how you would have performed if you basically just traded, WallStreetBets.
Most recent meme stocks, with about a one-week delay. So here, I wanted to show you guys how to get the data into Python. So it's really simple. We built a package on the API. So you just import the quiver quant Python package, connect to the API, using your token that you receive, and then read in the data from the endpoint, and below you can see an example.
What the data frame looks like from one of our endpoints. So each row here, as I mentioned earlier, corresponds to a ticker mention and we also have columns with data on stuff like the number of mentions of puts and calls and sentiment. And this is one of our simpler endpoints. We have other ones where you can see the full comment text of the comment mentioning the ticker, but for the purposes of this example, this endpoint will be just fine.
And on the next slide, I'll show you guys what the results ended up being when we back tested this strategy. I'm not going to walk through all of the code to implement the backtesting, but if you're interested in seeing that feel free to shoot me an email and I can get you a copy of the Python notebook.
So here's what it looks like. Obviously I'm sure you all know what the big spike on the right is from over the past couple of months, all that crazy movement around GameStop AMC and other meme stocks. Over the long-term there hasn't really been any significant alpha I guess generated from just mimicking what's being talked about on WallStreetBets with a one-week delay.
So, I mean, this obviously isn't something that we're endorsing that you start doing yourself, but I do think it's kind of an interesting piece of analysis to look at how a portfolio that was based on slightly lagged trading on WallStreetBets discussion would perform. On the next slide, I just want to give you a look into what the portfolio is comprised of over the about two and a half years that the backtest went back. You can see the most frequently held stock was SPY, which makes sense. It's no matter what the market conditions are, people are interested in how the markets are doing as a whole.
And then second and third are some like more traditional WallStreetBets, meme stocks like AMD and Tesla. Whereas some new companies like GameStop are more towards the middle of the list. So here kind of like here are the kind of the primary use cases, which we imagined for the WallStreetBets data. Risk management is the first thing that comes to mind for me.
Obviously, if you're, for instance, in a short position, in a company it's probably worthwhile to keep an eye on whether there's retail interest building in the ticker that you're trading, but there's also stuff like gauging retail sentiment. And this doesn't just apply to sentiment on the market as a whole, but also towards sentiment on individual tickers.
So for instance, below you can see a visualization I made of sentiment towards GameStop on WallStreetBets versus the number of mentions of Gamestop. And lastly identifying the meme stocks of tomorrow. So obviously you can see the utility and keeping track of where the focus of WallStreetBets is turning and often you can kind of get a heads up before something really blows up into the discussion. Like often there's a lag of a couple of days before it starts entering the discourse. And then when it blows up and turns into a Gamestop or RKT type situation. So with all that being said, we wanted to open up the discussion to some Q and A.
So if you guys have any questions just let us know and we'll do our best to answer them. So, one question was, do we source any fundamental data? And the answer to that is right now? No, not really. We kind of see that as something that's already being done by starting to be done by a lot of other companies.
I think a lot of fundamental data you're able to get quite a bit of fundamental data for free right now. And there are quite a few other companies who have kind of made that their mission to provide like a Bloomberg alternative basically, but just for fundamental data. But we always saw our mission to the alternative data space.
Like if you Google like alternative data, if you go to like Quandl or something, it's not even offered to individuals, it's only offered to institutional clients. So, far our focus has been mainly on just providing that alternative data
[00:30:10]James: I see another question here. Have you looked at scraping StockTwits? I believe recently StockTwits has kind of taken over there, they have their own commercial product that they sell.
If you'd like access to their discussion feeds. So you have to go through StockTwits. If you'd like to get access to that. I think they used to be a bit more permissible with things like what you're able to scrape from their site. But you know, now that they're selling that on their own, I think that you should probably go through them.
So what kind of NLP processing do you do to calculate your sentiment scores?
Chris, do you want to talk about that?
[00:30:38] Chris: Yeah, I can handle that. So it's a variety of things. Like we provide basic built-in sentiment measures. Like we use the Vader sentiment score in Python, for instance, and just some more commonly used methods of judging the sentiment of comments.
But we also do some proprietary stuff. Like there's obviously, it's obviously a bit more complicated to judge the sentiment of like a discussion on a specific forum. And there's a number of things we can do on our end to try to, I guess try to factor in, how discussion happens on WallStreetBets.
So we also have been working to create some of our own proprietary sentiment scores, but at the most basic level we just do, we also provide stuff like just number of mentions of like puts and calls, which when you, when you look at that data, I think it provides a pretty decent proxy to the sentiment of the sub as a whole, I guess when you're just judging it from an eyeball test.
[00:31:29] James: Yeah. Yeah. One of the issues with WallStreetBets, in particular, is that there's a lot of lingo and stuff on that subreddit that's super specific to that community. And isn't going to be found in your typical, you know, like natural language processing engine you know, phrases like diamond hands, rocket ship emojis all have really strong, positive connotations on WallStreetBets, but you know, aren't really common phrases that people are throwing around.
So with that in mind, we're, you know, we've been trying to do some work, like use some more keyword tracking and making sure that we're able to incorporate some of those very loaded phrases into what we have available to offer. With WallStreetBets, becoming mainstream and having a public focus now, do you think there's still any alpha to be extracted from monitoring it anymore?
I will say that you know, recently, obviously, there's been a lot of interest in this place. I think that almost all of the major hedge funds are now obviously aware that this is something that's worth monitoring and there's been a lot of interest from hedge funds to start tapping into this data feed.
So I definitely think that you know, there's going to be a lot less like just, you know, like pure alpha to be found from these datasets. But I think that one of the most important ways that you can use this data is as my brother mentioned earlier, as like a risk management tool where maybe you're not the only one who's able to predict what WallStreetBets is you know, suddenly going to be hyping up in the next week, but it can still be a very valuable way to make sure that if you have any short positions, they're not exposed to all this like retail interest and to kind of stay ahead of the curve as far as making sure that you're not getting positions blown up by the WallStreetBets community.
[00:32:58] Chris: I see a question. Any plans for adding similar data sets Ex-US right now? Especially with government data has been really US-focused, which is probably, I mean, a product of where we're located out of. But this is definitely one thing we're looking for in the future is we have a lot of these data sets and we kind of, we're starting to look more like, I guess, similar corollary.
So for instance, obviously, there's, the obvious example of looking at like other countries, government disclosures, and stuff, but there's also stuff like looking at, for instance, other subreddits aside from WallStreetBets, to get their discussion data and kind of, I guess, building out a little bit of a bit more diverse portfolio of data.
[00:33:35] James: Have you had any issues with sites banning your servers due to your web scraping? What about privacy concerns around scraping? An example of Redditors not wanting their comments scraped. To answer the first part of that question, when we first started out, we definitely were a bit less cognizant, I guess, of some like the licensing in terms of use agreements that certain sites had that we were scraping data from.
So there were a couple of instances, like very early on where we received the cease and desist letters from certain sites that we were scraping data from. But basically ever since then, we've been extremely cognizant of all the licensing restrictions been making sure that all of our scrapings falls, the acceptable terms of use so that we don't, you know, avoid getting one of our datasets in jeopardy of needing to be pulled from our site and we need to stop scraping from it. So definitely that's an area where we need to put a lot of focus just to make sure that we have the correct legal rights to scrape the data and then repackage it and sell it. And then in terms of privacy concerns around scraping, that also is something that we pay a lot of attention to.
Obviously, there, there are a lot of alternative data companies out there who will basically resell very personal information, whether it's, you know, selling your data on like your credit card transactions or, you know, gathering your personal information from your house address, like things like that.
Like very personal consumer information is being sold to hedge funds and often occurs within the alternative data space. So we try to make sure everything that we have is pretty far removed from any of these potential privacy concerns. We aren't scraping like any, you know, personal information.
We're not scraping like credit card data or anything like that. There may still be an issue, I guess, of like some Redditers for example, not wanting their comments scraped but again like this is all kind of publicly available information that, you know, when you post on or any Reddit community, basically, it's, it's just public and out there.
So we're, to a certain extent, just kind of aggregating what people are already putting out in the universe themselves. And also the data sets we provide are anonymized. We're not like tying people's usernames to the data feeds we provide. So, it is pretty far removed, I guess, from most privacy concerns.
[00:35:32] Chris: I see another comment that negative 296% return that was positive 296% return.
But if there was ever an example of past performance, not guarantee future results, this would probably be it. That was mainly, I think it was, I think there might've been like a 10% or 20% return above market prior to the big January spike. But I mean, obviously, the past month has been the main driver of alpha on that simple backtest.
I do think though that like, that was just pretty much as simple of a strategy you can build from the WallStreetBets discussion. And I do think there's the potential for generating more stable strategies, I guess, using a bit more advanced techniques, I guess.
[00:36:13] James: Owen McCadden asked, is there a free trial for the API?
Currently you can get a one-month free trial with the promo code Twitter in all caps on checkout. And I believe after this presentation there may be some more info about a potential longer free trial that's available as a prize or something. I don't want to ruin Jason's surprise here at the end, but stay tuned for that.
I guess so, yeah. I mean, I guess that's, going to be it, for Q and A for now, but just to wrap up and give you an idea of what we're looking to work on going forward. You should keep an eye out this April. We're planning on launching a mobile app to the Apple store and then the Google play store.
So this is just going to basically bring all the futures of our web platform to mobile devices. So it's super easy to keep on top of these alternative data sets from your phone. And again, we're going to continue kind of trying to work on new partnerships with any other like trading platforms, any other companies in the investment space, basically trying to work to get our data in as many hands as possible.
And then, of course, you know, always continuing to come out with new content on our Twitter platform through the newsletter that we send out to all of our users doing a bit of our own analysis and these data sets and trying to extract insights and sending it to everyone who I guess is following along.
So definitely stay tuned. You can sign up at quiverquant.Com if you want to stay in the loop on all the latest I guess, features that we'll be adding. And then also through our API, you can start tying directly into some of these data feeds. I think we'll now be going to break.
[00:37:36] Chris: Hold on, hold on. Before you sign off we still have one more minute. I see a couple of questions about Bot noise on WallStreetBets. And we do quite a bit of work on our end to try to remove that sort of noise or remove any individual, basically having an outsized impact on the data that we're collecting.
So that is one thing we're cognizant of, but with that being said, yeah, thanks to Jason for having us on and we appreciate your guys' time and questions and yeah, I think we're going to be going to break
[00:38:04]Jason: Thank you, James and Chris, that was very informative. I know a lot of our users are going to be interested in looking at different types of alternative data that they can use.
So yes, now we're going to be taking a five-minute break. We will resume at noon, 12:00 PM Eastern with Pierce Crosby, the general manager of TradingView. So enjoy the break, sit back, relax. If you have any questions, feel free to reach out to our Q and a box. We have Alpaca team members there to support. See you after the break.
I hope everyone enjoyed their break. Now that we're back, I'm going to introduce Pierce Crosby, the general manager of TradingView. He is here to talk about exploring the TradingView environment, which is going to be a live stream on the multiple features of TradingView. Pierce, it is all you.
[00:38:53]Pierce: Thanks guys, for having me always good to be hanging out with some actual algorithmic traders and talking about markets in general.
So as Jason said I'm the GM for TradingView. I sit in New York, however, you guys are actually catching me out in California, for a briefly extended vacay. Well, not really vacay, but remote work For those who aren't super familiar with TradingView. We're now like I guess close to the 65th, maybe 68th largest website in the world.
Well, I guess in terms of public data on a 90 day rolling average for the 75th largest website in the world, So we sit above CNBC, cnn.com, as well as most other kinds of financial media publications that you'd see out there. So really TradingView, you know, in a nutshell, is a place where people connect and talk about markets.
You know, we have everything from social features to things like live streams, as well as things like news top insights, et cetera. But most interesting of course, for this conversation, is our core charting tools. So again, all this is available for free. We don't, we don't actually charge for usage of about 80% of our product and the remaining 20% we have premium features, which I can go into later, but you can find all this information, just go to tradingview.com/gopro. If you want to see some more of the premium stuff. So I'll close this out and then we'll actually look at my version of TradingView today. So once you're signed into TradingView you'll see kind of a more customizable experience.
I have, you know, a dark color scheme for, my personal preference. Just if you stare at screens long enough, ultimately, you know, the white color starts to really mess with your eyes which is very much the case with them, with me. So here we are kind of in the product itself, you know, core features that you'll start to see are things like the obviously charting libraries we have a real-time alert tool, social chats as well as a bunch of other, less than a bunch of other features involved within the kind of overview product. We licensed it in terms of data I know that was a common conversation in the previous chat. We licensed global economics data. We also licensed global fundamentals data. So we pull in data from both CAP IQ FactSet and a few other providers to kind of round out our global data repository. We also work directly with about 65 equities exchanges as well as 20 or so Crypto exchanges.
And then for FX data, we pull in data from about five or six different broker-dealers over in Europe, which provides most of our real-time rates for CFD products, equity products indices products, and of course spot rates for various currency pairs kind of around the globe.
So yeah, this is just kind of high level. Obviously, I'm kind of delaying the pitch if you will, from a pure technology standpoint, and obviously what we want to get to talk to is a specific kind of overlap of TradingView and Alpaca and what that looks like from a product standpoint.
So the core product, actually, I have it loaded up on a separate tab, so I don't even need to load that. The core product is an advanced analytics and trading platform. And pretty much what you see here is our core home page for the advanced chart. Once you're here, you can definitely see the kind of scale and complexity of the tools that we do offer for folks who really want to take that deeper dive.
You know, I just listed a couple of different types of assets that we obviously have on the platform. You know, we have all say you know, government bonds for global listing. So if you wanted to look at it. You know Japanese bonds versus US bonds. We have all that data and to be clear, not just the spot, right, but obviously yields as well.
You know, Bitcoin is obviously a very popular conversation as of late. So we pull in again, you know, data feeds from, from upwards of 20 different crypto exchanges. Spot futures data. We have global futures from CME, CBOE, and a few other sorry CME CBOT as well as a few other global futures providers as well.
And funny enough, we actually just recently, as of this month launched the availability of global futures data for actually four bucks a month. For most providers out there, the lowest price you're going to get for global futures data is closer to a hundred bucks a month. And so now we have little futures available for four bucks a month. For equities data you know, it's readily available for you to know, anywhere from a dollar to $2 a month as well. So all in, if you wanted to get real-time global data, Cost you anywhere between two to five bucks a month across the world. So this is kind of the day-to-day for, for people on TradingView they lived in the charts.
There's a lot you can do within a given chart panel itself as well. All this is completely customizable too, you know, the exact look and feel that, that you might want for your daily setup. And a lot of people think that we are, you know, like a technical analysis platform, but we do a lot more than technical analysis to be clear.
So one core feature that I think is really interesting is that people on TradingView actually code up their own custom scripts. And so we actually have our own native language called Pine which you can see here is kind of the terminal function. So I could actually code if I was a coder actually code up my own scripts, natively, insider TradingView.
And so what you see here is actually a script that was shared by a community member, which looks at a mashup of every moving average in a single pane, and then applies a heat map over top of that. And so of course it's, you know, somewhat helpful for me just to get a general idea of what's happening in the market without having to look at specific technical levels or anything like that.
And then from a global fundamentals perspective, you know, anything that you can possibly want to chart from a fundamental data perspective. We also have that in TradingView. I mean, if you really cared about after-tax, you know after-tax income, you know, you could chart it. I wouldn't encourage that specifically, but relatively speaking, you know, you want to do something simple, like just earnings data let's see the price to earnings, retained earnings, equity earnings, pre-tax earnings.
So I'd say we'll do a quarterly basis rather than annual data. We can actually start to zoom into the global fundamentals of a company, rather than looking specifically at the overall say technicals or key indicator of a platform, like that. So you can obviously change the chart types you know, for fundamentals.
Obviously it's going to be a little wonky because we have the negative fundamentals here, so you can invert the chart if you want. But yeah, from a different product perspective, you know, you can kind of display this in any way, shape, or form. I'll pull up you know, kind of the core chart itself and give you guys a sense of what charting capabilities or functionality we have.
So obviously people are very fond of things like area charts, Renko line charts, Kagi charts, pointing figures for the old schoolers and all these are kinds of you know, plug and play. So they all come with the product there are no additional needs to kind of pull in more data. And so, you know, what we've kind of done as a product is again, you know, position ourselves kind of the all-encompassing front end, but obviously, that leaves you know a lot to build in when it comes to trading and investing itself.
Right? So we, again, specialize in front-end tools, but from the actual backend side of things, the kind of next step is obviously how do we make this actionable? So a few years ago we started building in level two data. So we can now get real-time level two data for a lot of various markets and assets.
And the next step would actually be you know, how do we take from level two, to actually the actual trading side of things. So here you see, you know, it's asking me how do I connect the various broker-dealers? So I would actually pull up the charting panel itself down here. And these are the number of connected investing firms today.
We do have a lot more in the pipeline but it's a pretty good bench of partners thus far. Alpaca was actually one of the early adopters in the US of the product. And so we're big fans of the company and kind of what the team is building in terms of a developer-first model because that's very much our approach with TradingView is, you know, we're much more quantitative by nature in terms of the audience that we look to address and thus wide, you know, our strategy testers, our Pine editors, et cetera. Our kind of a core if you will for a lot of kind of sophisticated traders. So in terms of the next steps for this, you know, we have an open architecture on the backend. I'll show you what that looks like here.
So basically we have an open trading architecture so that people can actually review this at any time. They want to understand what data is being grabbed or stored on the TradingView side and what data is simply being passed to Alpaca. So in this case for Alpaca, we use OAuth to connect directly.
And so I'll show you now, it's pretty seamless. It just sends that OAuth recognition over to Alpaca to confirm that, you know, I am who I say I am and I'm actually able to access my own account. So here's a TradingView if you need to email me feel free, but I'll mark you as spam if you know you keep emailing me too often.
So hopefully the request calls are brought back and now we're live. So I actually have a position on today just as an example, recent volatility for the most part has kind of kept me on the sidelines. So not a lot of trading activity, see here but in terms of, you know how this actually works in real-time, now that I have my account connected, I can actually pull up the order management ticket and actually see what spot prices it was available with Alpaca.
So more or less, you know, now I can trade in real-time from TradingView charts. And so this is kind of the best of both worlds, right? Because obviously we're never going to be a trading firm ourselves, but we do want to work with trading firms in order to actually, you know, complete that user life cycle.
So say I made a simple, you know, trade today, you know, I can put in a different order. Say I wanted to do just a simple market order. You could do limit orders with various, you know, take profits and stop losses, you know, obviously both on buy and sell position types. And, you know, if you want to put your positions way outside the bid-ask, you can, and they'll just sit there in real-time.
I'll show you just an example of what that would look like from a simple ask perspective. But I mean, the idea here, right, is most people want to connect to Alpaca programmatically within their own systems. A lot of investors just want to kind of get a quick snapshot as to, you know, how do I trade and how do I connect as soon as possible?
You know, we aim to make it as simple as possible for those who are not nearly as algorithmic, algorithmically driven, or might have kind of a semi-discretionary strategy or approach. So simply put, you know, if I had a hundred shares that I wanted to sell and actually I can't make that order because I'm trying to do a bracket, but I don't need to do a bracket for a sell order.
But yeah, simply put then I can more or less make that transaction in real-time from TradingView so it's relatively simple. And I think that's actually the benefit of what we've built with Alpaca is the simplicity of being able to, you know, input those orders. You know, ideally, Alpaca will launch more markets.
We're very excited about that opportunity and be applicable to a lot of different investors around the world, just by kind of, you know, background, you know, the US is the largest market for TradingView but we have audiences in upwards of 180 countries, anywhere from whether it's Japan, South Africa, you know Singapore, Hong Kong, Australia Malaysia, you name it.
We have audiences. And so it is really cool that I, as an individual investor, can connect with fellow traders who, you know, might also just, sitting in their basement trading foreign currencies, or what have you. What's cool too, is for people that are tuning in from around the world and we also have various language versions as well.
So if you're Turkish, we actually have a completely Turkish version of TradingView. Everything you'll see is natively translated. So you don't have to worry about using Google translate or something like that. And these are all ideas that are actually published by people in Turkey which is kind of wild, but you have a huge trading audience in Turkey.
Don't ask me how or why. We also pull in, you know, local Turkish news. So you have real-time news feeds in Turkish for kind of your use as you see fit everything's globally translated as well. So again, if you want to pull the fundamentals data, you know, quick snapshot on financials, technical signals, and ultimately the best part is, you know, connecting with fellow investors.
You know, this would be a great way to tap into, you know, your Turkish audience, if you will. So this guy has an example, no idea who he is, but in terms of his, you know, kind of breadth of experience, I mean, he's been publishing on TradingView for quite some time. The real kind of benefit of TradingView is it's not just a trading platform.
It's a great place to connect with fellow investors and traders. And yeah, I mean, I actually don't know what this says because it's in Turkish, but I'd assume that these are, yeah, these are a number of followers. So he's got 2,800 people following him. Almost 10,000 people have liked his trading and investing ideas.
And it's a pretty good kind of sign of confidence that he knows what he's doing. So that's I guess the stage one of TradingView. So for me, you know, the way I use it on a daily basis, I obviously follow a lot of people that I can sort by to make sure that I kind of you know, really kind of follow the people that I trust and know.
So I also only really trade stocks and futures. So I can look specifically at the US stock market and see, you know, what are the most popular ideas, for that game and market and why? So, you know, Angus is actually a moderator for us, but he also produces really interesting trading ideas. But this guy, you know, top trading signals are looking at, you know, certain technical levels and breakouts.
A lot of people talking about the sell-off that we've been having over the past couple of days. And that seems to be kind of a, the predominance of the conversation we'll using things like track goals you know, standard TA, et cetera. And what's really cool and something that actually people don't know a ton about with TradingView is if I find an idea that I do actually like a lot. I don't want to go through the process of, you know, kind of recreating this myself. Right? So funny enough TradeStation actually published this idea on TradingView, TradeStation is another broker partner that we have on TradingView. So, you know, I can see how that idea has done over time.
And if I like the TA or the kind of the different types of analysis that they're doing, obviously looking at MACD and moving averages across the board, what's really cool is I can actually just copy that idea of myself. So there's this hidden feature, not so much hidden, but I guess it's maybe not as talked about nearly as much to make it mine.
And once I click this, it'll take me back to that chart page, which is again, where people spend 90% of their time and, and more or less it copies over a lot of the core tools and features that you actually just saw on that chart. So now I actually have those real-time ideas on TradingView and I can do it then what I want.
So if I wanted to actually add my own versions of this, or kind of do some simple updates well, you know, and more or less, you know, abbreviate certain areas that I think are really important for the overall investor. You know, this is a simple way to basically take what previously was a static image and make it your own and, and actually continue to annotate and update over time. We think that this is kind of a huge value add for customers because basically, you know, we're talking about a very significant collaboration tool where people can actually, you know, take an idea from a friend, add their own analysis to it, you know, then basically publish that back out into the world and see kind of how friends kind of perform or you know, improve each other over time. So I think that's pretty good. I guess another feature that we could probably talk about just a little bit, and actually, this is pretty applicable to the algorithmic trading side of things is our alerts tool and alerting functionality. Again, we don't talk about it nearly enough versus where we could, but the alerts tool basically is a way for you to automate your level setting so that you don't have to be glued to your screen every day.
And I don't know if people are familiar, but we also have a very popular mobile app. So the alerts that you built can actually be set across devices. And then I can get a simple notification on my phone anytime, you know, levels are crossed, or certain indicators are broken or kind of you know, divergences are had and you can make indicators and alerts off of everything.
So whether it's a volume study, whether it's the mechanics of the market, certain kinds of indicators, et cetera, that are, getting kind of ping. Those are all made into alerts. On a daily basis we have about 15,000 alerts and in terms of the numbers of those fire off they're in the millions, you know, people are firing off millions of alerts every day to basically help them improve their overall trading.
What's cool too, is that, you know, obviously you can fire them off natively to TradingView so that, you know, you'll get notifications from a web browser perspective from a mobile application perspective. But in addition, you can send them to your email. You could also create a webhook URL.
So for those who have their own trading systems, or want to hook this back into Alpaca, you could actually have this redirect to an endpoint that you have set up to basically trigger based on a specific number of features or parameters set. And so if I was to redirect this to say, Pierce crosby.com/apple alert, you know, once that webhook fires off, you know, my own internal system could more or less, you know, trigger that, that trading transaction and then write an order to Alpaca.
We haven't actually done full automation ourselves. And the reason being is, you know, we very much think that the pulling the trigger, if you will, is still very much an activity for the individual investor to do themselves versus TradingView, building automated strategies, and then having them run in real time, but safe to say, we're really not far away from that.
It's just a matter of the industry kind of shifting in that direction to a critical point where, you know, it's kind of demanded by, by all our customers, but you know, to date, we've really kind of focused on discretionary trading. And that's simply because you know, we don't really want to be in a place where somebody accidentally codes something incorrectly in Pine, and that ends up kind of blowing up their account or something like that.
So we've stayed away from strategies similar to Say eToro or something, which is, you know, very famous for copy trading. And we very much are not a registered broker dealer or have any interest in going in that direction. So we have to be very careful when it comes to trade automation and, and kind of the agency of somebody who's committing to trade automation.
So I think that that's a pretty good summary of the platform on top of that, when we go back to global fundamentals, which is super popular, what's interesting too, is that you can not just look at, in kind of chart format, but you can actually use our global screeners as well. So we have a ton of different either market conditions or fundamental descriptions or actual kind of company description information that you can filter and sort by in total, I think we have an excess of 500 different things that you can sort and filter by in order to basically give yourself a pretty clear indication as to things that you're interested in and why that should be you know, compelling for you over time. Again, what's really cool is all of these can be saved, right? So that, you know, once you've built your standard filters, you know, you don't have to do this every day. When you come back to the market, you can basically set it and then, you know, return to it once a week, if you need to kind of review how things are going.
So for me, I have specific earnings calendars which are kind of, so we pull in obviously earnings data on global companies as well. And then for me specifically, you know, I care about a specific range of market caps, as well as things like diluted EPS, enterprise value overall. And then if you simply want to add other things as well, it's very simple to just plug in additional columns so that you can kind of look at things like, let's say a price to sales ratio.
And again, once you have these kinds of presets, you can filter further. So if you want to price the sales ratios to be below well, let's see no below zero wouldn't exist, but the price to sales ratio of one. So anything that is less than one from a price of sales ratio perspective, and then you can filter by that so that you can look at the lowest price to sales ratio companies in whatever kind of universe you're focused on.
So I only have the US, but we obviously have again, global fundamentals, data and global markets data. So you could actually look at the lowest price to sales ratios, companies in France or Germany if you want it to. So we're coming up on time so I could probably stop there. And if there are any questions, I'm more than happy to jump on those, but again, thanks, guys. It's been a pleasure. Yeah. Any questions that you guys want to follow up with directly? Feel free to reach out to me on TradingView on Twitter. We're always taking product feedback from customers. And so we're super happy to know, listen in to if we can be helpful.
So I'll jump into the Q and A let's see. We have any questions. One question coming from Ryan is can you create alerts with API, meaning writing programmatically to TradingView to build alerts that way it's kind of the reverse. So we have webhooks for people to kind of, you know, link out to, to various companies.
But we have kind of the walled garden approach where you got to build everything on TradingView. The same goes for code, right? So a lot of people want to import their code into TradingView and we kind of actually think the reverse. So we want people to code natively in Pine and in fact, we have upwards of 10,000 scripts.
We built last year. So these are kind of indicative of the number of, kind of potential tools that people are building on TradingView, and crazy enough, these are all actually available for you to use at your discretion. So we have a bunch of built-in scripts. So like, you know, these are the things that come with the platform, but then the community basically creates a repository.
And so, you know 70,000 or so people are using this specific indicator created by lazybear. Chris Moody is super popular on TradingView as well and has created a ton of different scripts and volume profiles, et cetera. And so to use some of these, some of these are restricted in terms of actually using the sole source code.
But if I found something that seemed pretty interesting like this is a pretty funny one that people thought was pretty popular the other day. I can actually look at the source code myself And you know, more or less, obviously what you see as a restricted version, but if you go up here and actually make a copy of that, you could code your own copy and then start changing around a lot of the fields directly from Pine, which is the editor.
And you can save all your scripts natively. So you could build your own repository. I don't think I have any on this account. Let's see if I do, no, I think I don't, but yeah, that'll give you a sense of, what's actually possible there,
Is there any way to convert Pine into Python or vice versa? Well, so this is a request we get a lot. The language is pretty congruent, or they, basically do talk pretty well together if you will, but we don't have a native translation package that would allow you to connect to Python.
However, I mean, our kind of Pine coder community is always making requests like this. So stay tuned because I do think that we'd have some, some upcoming information around you know, kind of additional usages of external languages. Whereas today we, you know, we, everything native to Pine. So Pine is kind of the bedrock of our language. What stage of integration with IB currently at?
So I guess somebody has heard a rumor that IB is going to be integrated with TradingView while, you know, I actually do prefer the integration with Alpaca, because it is pretty streamlined, super-efficient, and easy to use. We do expect IB to also come live relatively soon. And that's actually probably before the first half of the year, can't say, much more than that, but, yeah, that's, kind of a great kind of indication as to where we're headed.
We're definitely always looking for more trading partners. And the reason being is, you know, Alpaca obviously covers US equity markets, but a good example is someone like a Pepperstone or an IG market, which are huge requests in Australia, Singapore, you know, a lot of the Southeast Asia countries. So we're constantly integrating more trading partners to TradingView and by doing so, you know, hopefully being more helpful to a larger spectrum of global traders.
As I said, we have a global audience, so it's very important that we accommodate everybody in some way, shape, or form. Funny enough, we actually just surpassed 30 million monthly active users. So it's a pretty, kind of strong indication that we're doing well in a lot of countries.
[01:04:33] Jason: Pierce I'm so sorry. I can definitely, we could all definitely hear more about TradingView as I know I've used TradingView a lot and you know, my trading and investing career. But we're going to have to wrap it up now. I think that was an amazing presentation. If any other users have questions for TradingView Quiver Quantitative or an Alpaca, we will share with the respective speakers today.
So as we wrap it up, I just wanted to provide contact information for all of our speakers today. Again, here were our guests for today, Yoshi, myself, James, Chris, and Pierce. I wanted to thank everyone for stopping by and speaking. We also have some contact information concerning the websites, the Twitters.
So take a minute. If you want to make note of any of this contact info, again, the recording and the slides will be made publicly available so we can share it with them. And then, as we said earlier in the conference, we are going to have an after-conference Q and A. So once I end the webinar, you will automatically be prompted to complete an optional Q and A of 10 questions regarding some of the content that was discussed today along with some more general market trivia. And we will be randomly selecting winners with the top scores to receive prizes, which consists of pro or premium plans from TradingView subscription of free trial for the Quiver API, and credit towards the Alpaca market data API. So we will be providing these packages to randomly selected winners.
This is a limited five-minute Q and A and after you will not be able to submit your answers. And if you do choose to participate, you will have to authorize yourself with an email just so we can identify the winners accordingly. But that being said, I want to thank everyone for joining us today. I want to thank our speakers for presenting.
I wanted to thank everyone for getting an insight into some data and the importance it has for algorithmic trading and more in general, just trading overall. So stay safe and meet us at the next virtual conference.

You can also follow Alpaca and our weekly updates on our LinkedIn and @AlpacaHQ on Twitter!
Brokerage services are provided by Alpaca Securities LLC ("Alpaca"), member FINRA/SIPC, a wholly-owned subsidiary of AlpacaDB, Inc. Technology and services are offered by AlpacaDB, Inc.