Please note that this article is for educational and informational purposes only All screenshots are for illustrative purposes only. The views and opinions expressed are those of the author and do not reflect or represent the views and opinions of Alpaca. Alpaca does not recommend any specific securities, cryptocurrencies or investment strategies.
This article was originally published on Medium by Astarag Mohapatra
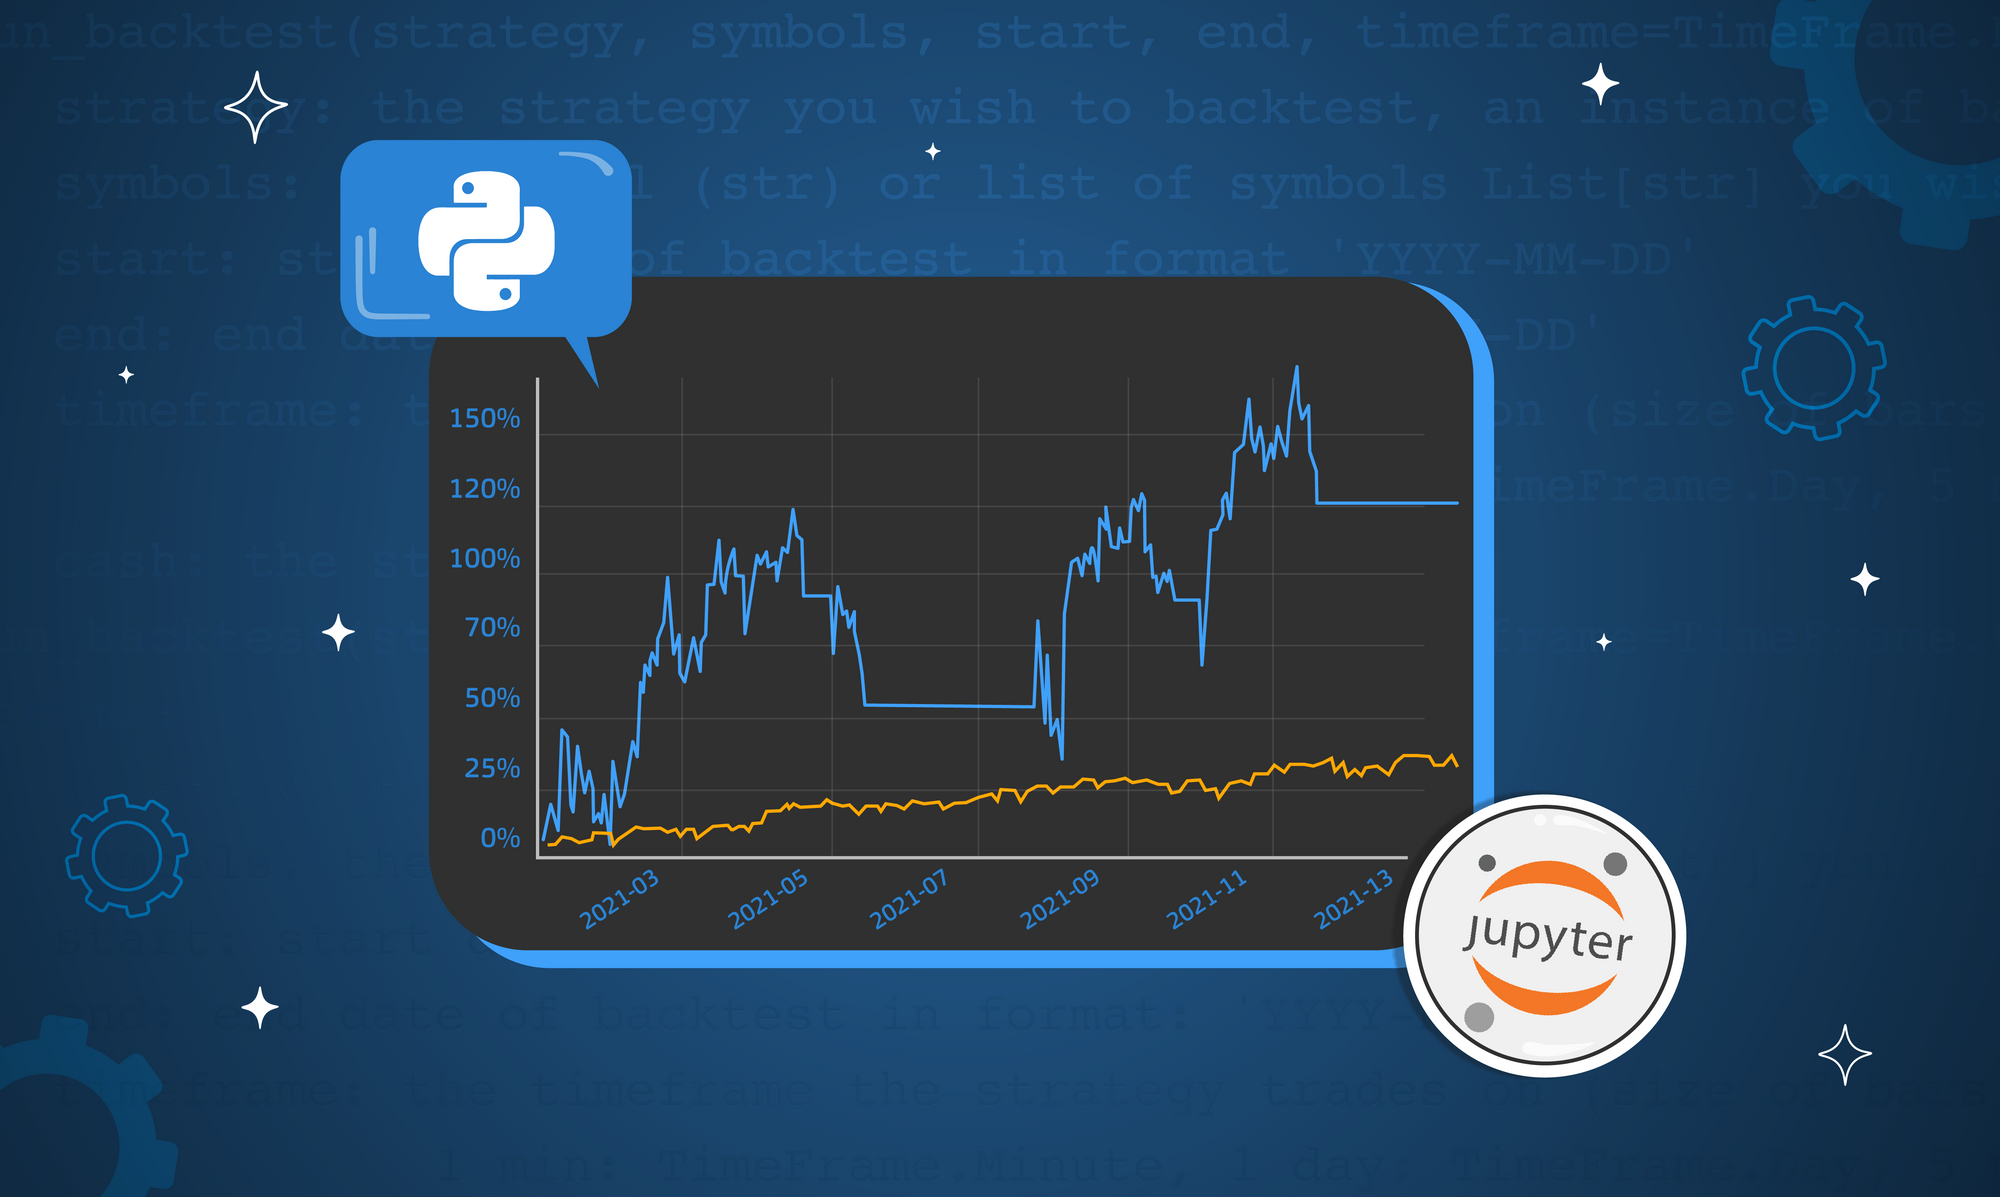
This tutorial aims to stream financial data, particularly Open, High, Low, Close, and Volume data using Alpaca Streaming API, and plots them using Streamlit in real-time.
The tutorial can be divided into three parts:
- Alpaca Streaming API v2
- Watchdog for tracking the file changes as new data comes in and re-run streamlit. This functionality comes out of the box in streamlit.
- Streamlit to plot the candlesticks charts for all the ticker symbols
The code for the tutorial can be found here.
 Athe-kunal
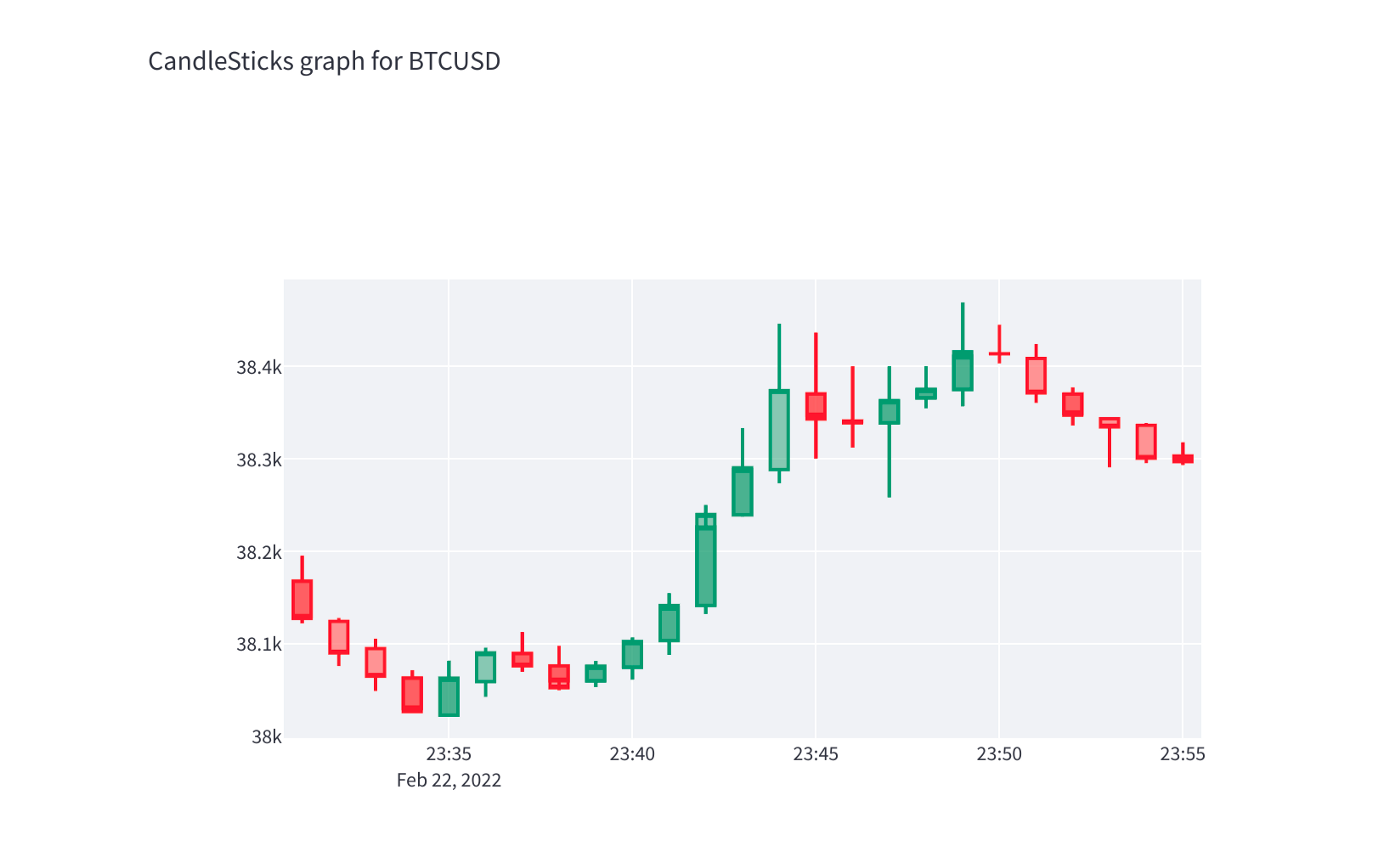
We will be generating candlestick plots for stocks in real-time.
Alpaca Streaming API
Alpaca offers simple, modern API-first solutions to enable anyone, either individuals or businesses, to connect applications and build algorithms to buy and sell stocks or crypto with zero commissions.
- You need to have your API keys and secret keys by creating an account in Alpaca.
- Under the hood, Alpaca uses a WebSocket connection to stream data. You can go through the code here. WebSocket is different from HTTP as it only requires a single handshake between the client and server during the initial request. After that, no handshakes are needed; thus, it reduces the latency of request processing.
- WebSocket is ideal for real-time communication between client and server, thus it is pertinent in our current use case.
- Alpaca provides a wrapper of WebSocket Client where we can pass our ticker symbol and exchange to start streaming data. The code for the following can be found below.
from statistics import mode
from alpaca_trade_api.stream import Stream
from datetime import datetime,timedelta
from anyio import current_time
import pandas as pd
import logging
import dummy
import os
import time
 #Pass in your keys and secret key
API_KEY = ""
SECRET_KEY = ""


dummy_path = dummy.__file__
async def trade_bars(bars):
    temp_df = pd.DataFrame(
        columns=["time", "open", "high", "low", "close", "volume", "tic", "vwap"]
    )

    present_time = datetime.utcfromtimestamp(bars.timestamp/10**9).strftime("%Y-%m-%d %H:%M:%S")
    temp_df["time"] = [present_time]

    temp_df["open"] = [bars.open]
    temp_df["high"] = [bars.high]
    temp_df["low"] = [bars.low]
    temp_df["close"] = [bars.close]
    temp_df["volume"] = [bars.volume]
    temp_df["tic"] = [bars.symbol]
    temp_df["exchange"] = [bars.exchange]
    temp_df["vwap"] = [bars.vwap]

    temp_df.to_csv("bars.csv", mode="a", header=False)

    print(bars)
    with open(dummy_path,"w") as fp:
        fp.write(f"timestamp = '{datetime.now()}'")

def csv_handling(file_name: str, columns_list: list):
    if os.path.exists(file_name):
        try:
            trade_temp_df = pd.read_csv(file_name)
        except:
            print("The file doesn't exist, creating it")
            trade_temp_df = pd.DataFrame(columns=columns_list)
            trade_temp_df.to_csv(file_name)
        if trade_temp_df.empty:
            trade_temp_df = pd.DataFrame(columns=columns_list)
            trade_temp_df.to_csv(file_name)
        else:
            pass
    else:
        trade_temp_df = pd.DataFrame(columns=columns_list)
        trade_temp_df.to_csv(file_name)

def run_connection(stream):
    try:
        stream.run()
    except KeyboardInterrupt:
        print("Interrupted execution by the user")
        loop.run_until_complete(stream.stop_ws())
        exit(0)
    except Exception as e:
        print(f'Exception from websocket connection: {e}')
    finally:
        print('Trying to re-establish connection')
        time.sleep(3)
        run_connection(stream)

if __name__ == "__main__":
    logging.basicConfig(level=logging.INFO)
    stream = Stream(
        API_KEY, SECRET_KEY, base_url="https://paper-api.alpaca.markets", raw_data=False,
        data_feed='iex',
        crypto_exchanges = ['CBSE']
    )

    csv_handling(
        "bars.csv",
        columns_list=["time", "open", "high", "low", "close", "volume", "tic", "exchange","vwap"],
    )

    # stream.subscribe_bars(trade_bars,'TSLA')
    stream.subscribe_crypto_bars(trade_bars, "ETHUSD")
    stream.subscribe_crypto_bars(trade_bars, "BTCUSD")
    run_connection(stream)
    print("Complete")
In the main function, you can see that we have defined a stream object. Make sure to use only one crypto exchange to stream the data else, and you will be streaming data from multiple exchanges leading to redundancy. Here we have used CBSE (CoinBase Stock Exchange). Other exchanges are also available, like FTXU (Foreign Trading Crypto exchange), etc.
Here we are trying to stream data for Ethereum and Bitcoin in real-time at the minute level interval. Alpaca offers other functionalities like streaming quotes (subscribe_quotes) and trades (subscribe_trades). Quotes are the record of order-book or bid/ask prices and trades are the price point at which all the current orders are executed. We only need minute-level data to plot the bars.
In the trade_bars function, you can see that we are trying to stream the data and write it to a CSV file named bars. So all the minute-level data are stored in bars.csv, from which streamlit will plot the candlesticks graph. Also, the time is a timestamp object transformed into the string format.
Making it real-time
In the above code, in line number #36, you can see that we are the current time to a dummy file. What is that for?
This gets us to the Watchdog library. It's a Python library that keeps track of all the file system changes. So when new data comes, and we write it into the CSV file, we want to trigger the streamlit app to re-run the plotting application.
Streamlit runs from top to bottom when something changes in the folder where the streamlit file is present. To detect any changes, streamlit uses the watchdog library. So we will import this dummy file in streamlit, and whenever new data comes, this file is modified, thus triggering streamlit to run again. The source for this idea can be found here.
So for the streamlit plotting, we have the following code
from matplotlib.pyplot import plot
import plotly.graph_objects as go
import pandas as pd
import streamlit as st
import dummy

def plot_data():
    df = pd.read_csv("bars.csv")
    tic_groups = df.groupby(by=['tic'],sort=False)

    tics = []
    figs = []
    for tic in tic_groups:
        df = tic[1]
        fig = go.Figure(data=[go.Candlestick(x=df['time'],
                            open=df['open'],high=df['high'],low=df['low'],close=df.close)])
        fig.update_layout(xaxis_rangeslider_visible=False)
        tics.append(tic[0])
        figs.append(fig)
    return tics,figs

tics,figs = plot_data()

#Plot data for all the ticker symbols
for plots in zip(tics,figs):
    st.write(f'CandleSticks graph for {plots[0]}')
    st.plotly_chart(plots[1])
In the above code, you can see that we are plotting the streamlit candlestick plots for all our ticker symbols. First, we group them by the ticker symbol, and then we save the ticker and figs from plotting them finally.
Also, you need to have a configuration file in streamlit inside ./streamlit/config.toml. Here we pass
#Re-run the server for Streamlit everytime there is some change
server.runOnSave = true
After everything is set up, run the following commands from your terminal.
python final_stream.py
streamlit run final_plot.py
Streamlit will redirect you to localhost:8501, where you can see the real-time candlesticks plot for your stocks.
Conclusion
This project is part of a long-term project of serving Reinforcement learning agents for algorithmic trading in real-time. We will be using FinRL to train RL agents for real-time algorithmic trading. For now, we have simple plots, but we are planning to build a financial dashboard with real-time information for users to compare the performance of RL agents to other strategies.
Alpaca does not prepare, edit, or endorse Third Party Content. Alpaca does not guarantee the accuracy, timeliness, completeness or usefulness of Third Party Content, and is not responsible or liable for any content, advertising, products, or other materials on or available from third party sites.
Securities brokerage services are provided by Alpaca Securities LLC ("Alpaca Securities"), member FINRA/SIPC, a wholly-owned subsidiary of AlpacaDB, Inc. Technology and services are offered by AlpacaDB, Inc.
Cryptocurrency services are provided by Alpaca Crypto LLC ("Alpaca Crypto"), a wholly-owned subsidiary of AlpacaDB, Inc. Alpaca Crypto is not a member of SIPC or FINRA. Cryptocurrencies are not stocks and your cryptocurrency investments are not protected by either FDIC or SIPC.
This is not an offer, solicitation of an offer, or advice to buy or sell securities or cryptocurrencies, or open a brokerage account or cryptocurrency account in any jurisdiction where Alpaca Securities or Alpaca Crypto respectively, are not registered.