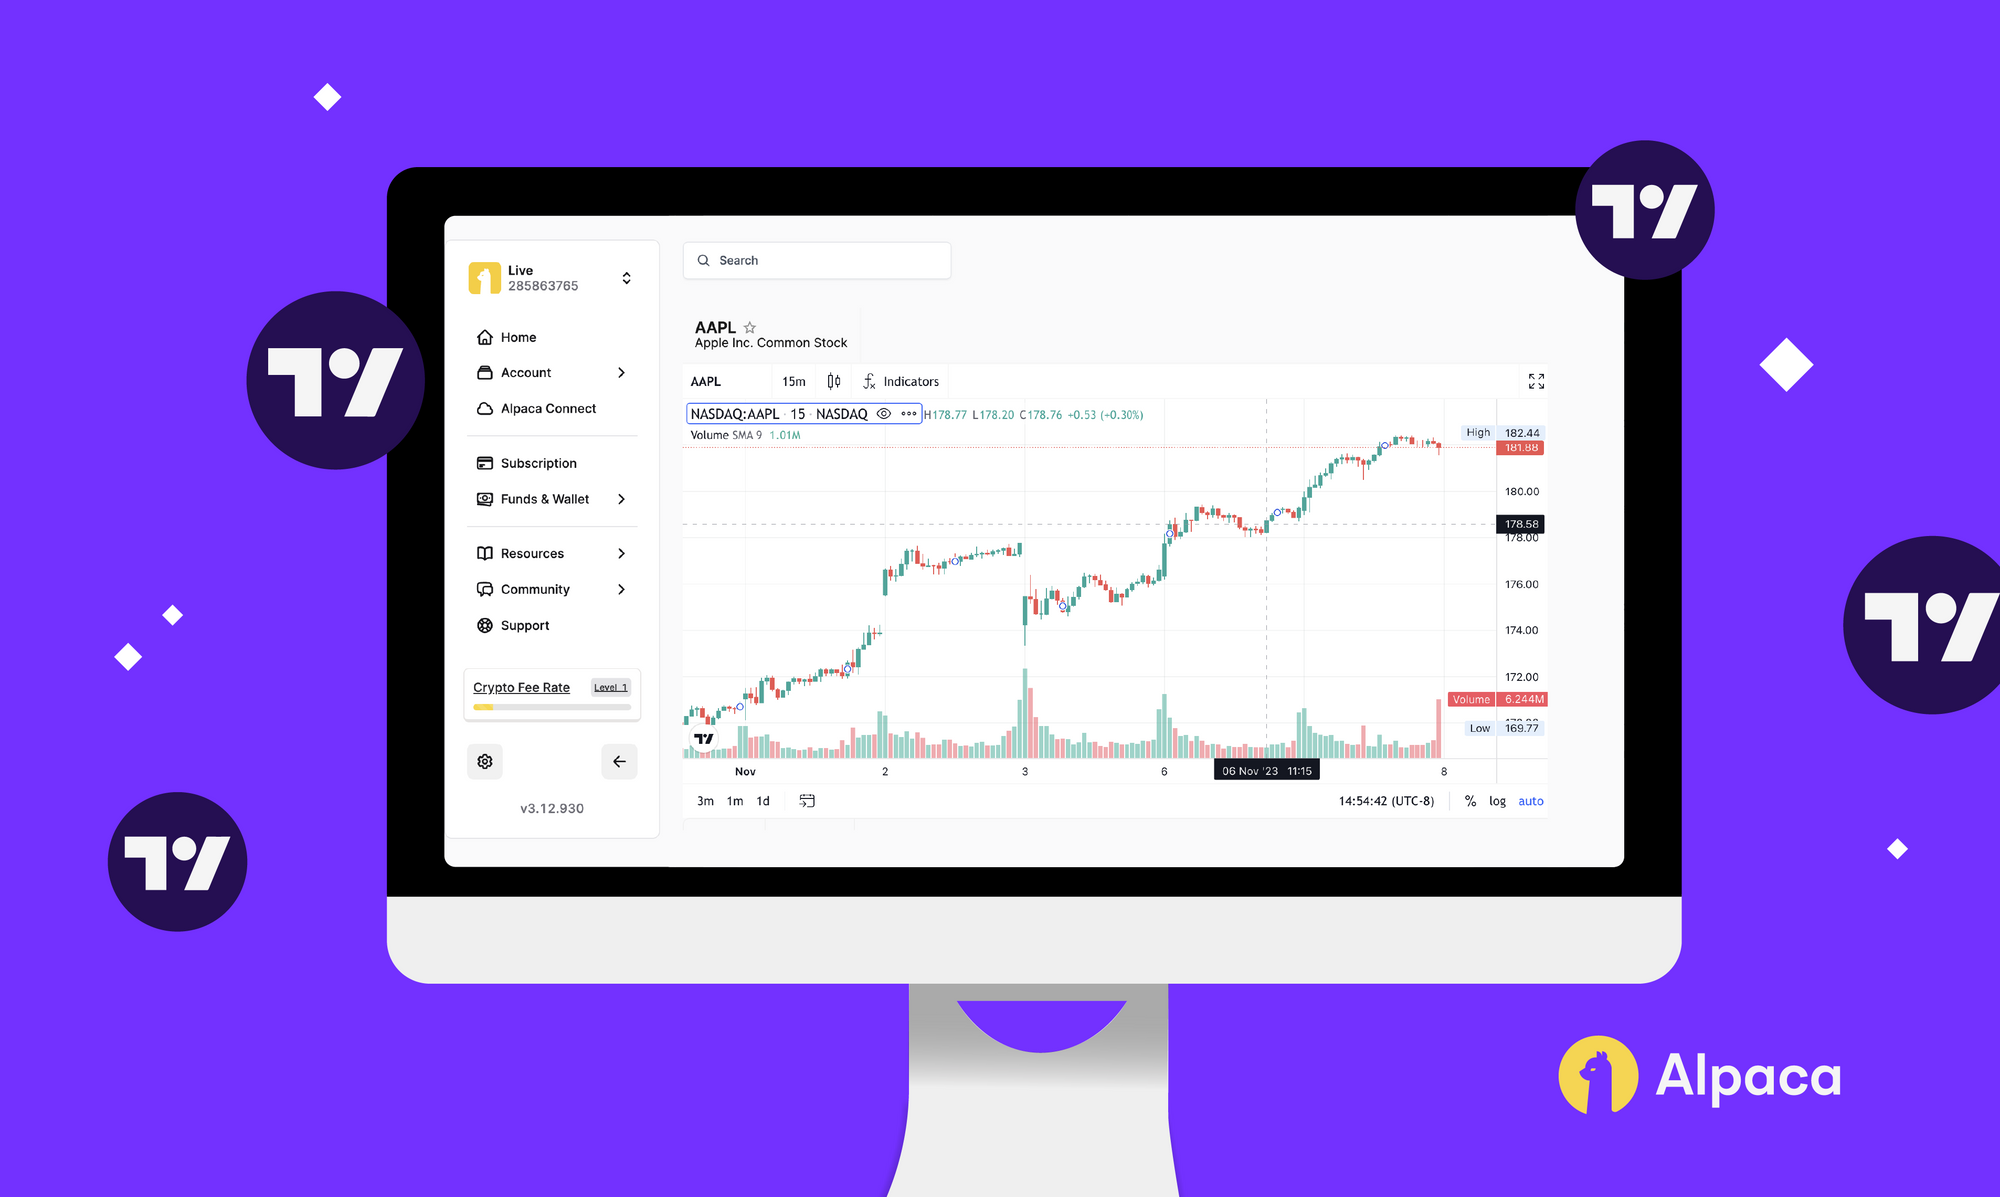
Alpaca’s dashboard utilizes TradingView’s technology to provide advanced charting. The charting allows you to view real-time market data, personalize chart data, view multiple indicators and other tools for technical analysis.
Sign up for a free trading account on Alpaca
If you’re new to Alpaca, please follow the directions below to sign up for a brokerage account.
Go to https://app.alpaca.markets/signup to create your account. Once you sign up, you will see the dashboard below. Please select either “Individual Account” or “Business Trading Account” to begin the onboarding process.

How to search a symbol & view real-time data
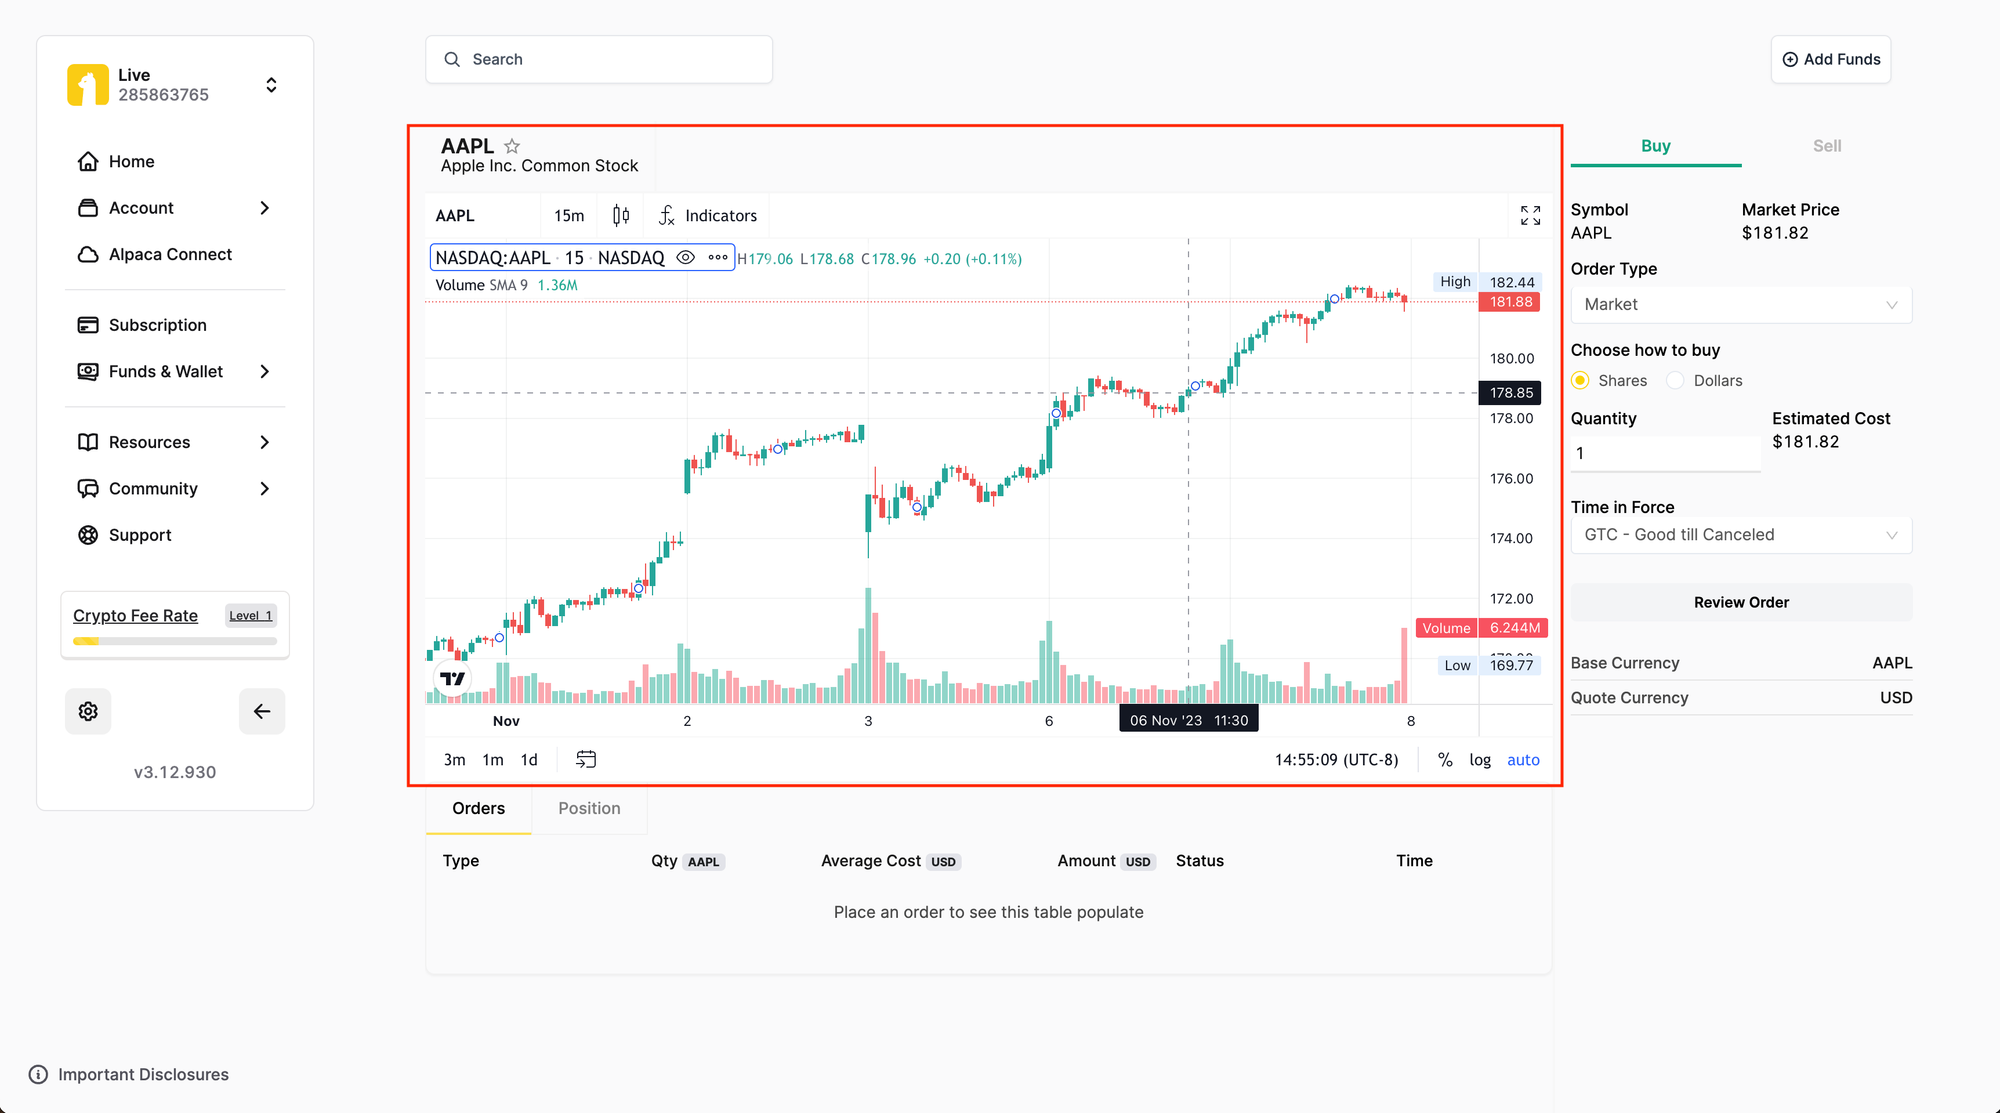
Once you’re logged in, use the search bar to type in a symbol. You can do this in both paper trading and live environments. We’ll use AAPL in the live trading environment as an example.

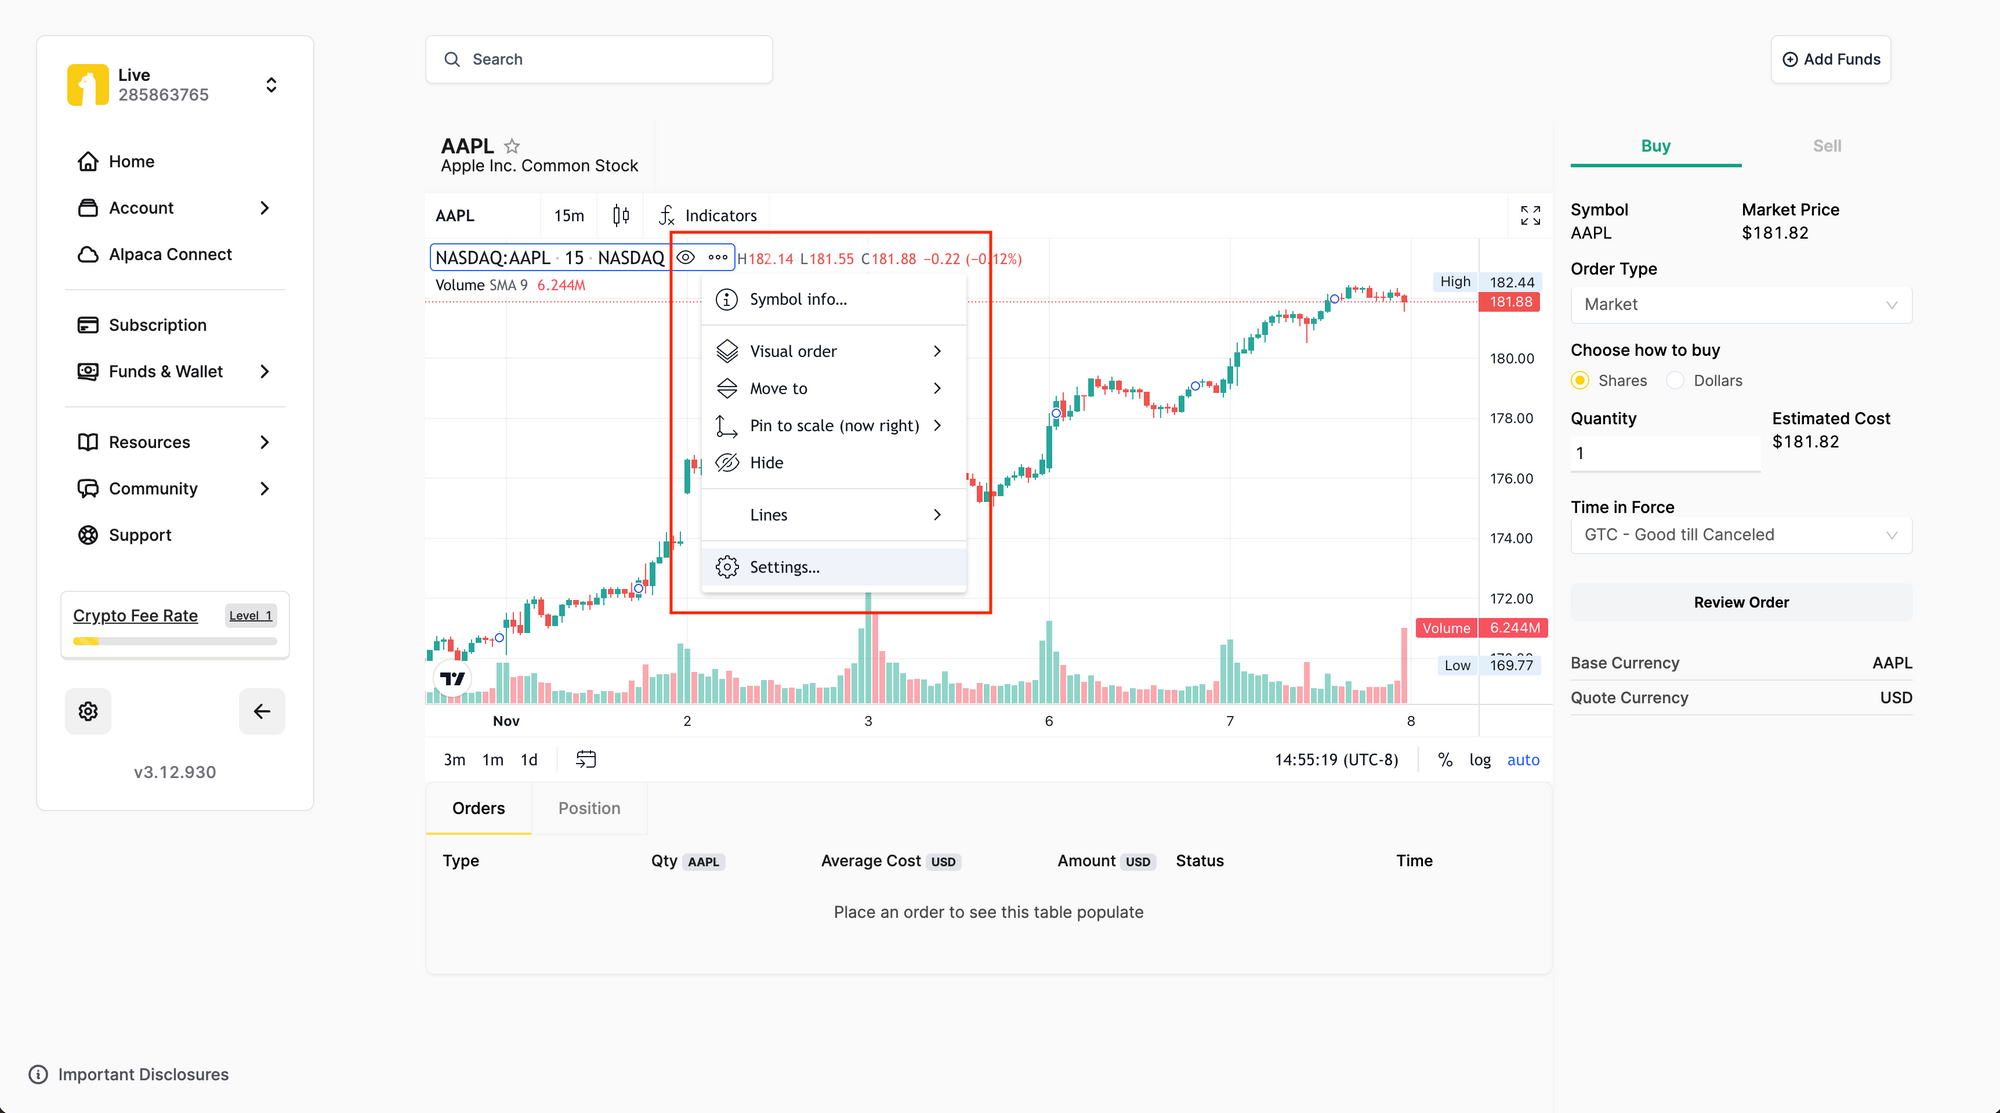
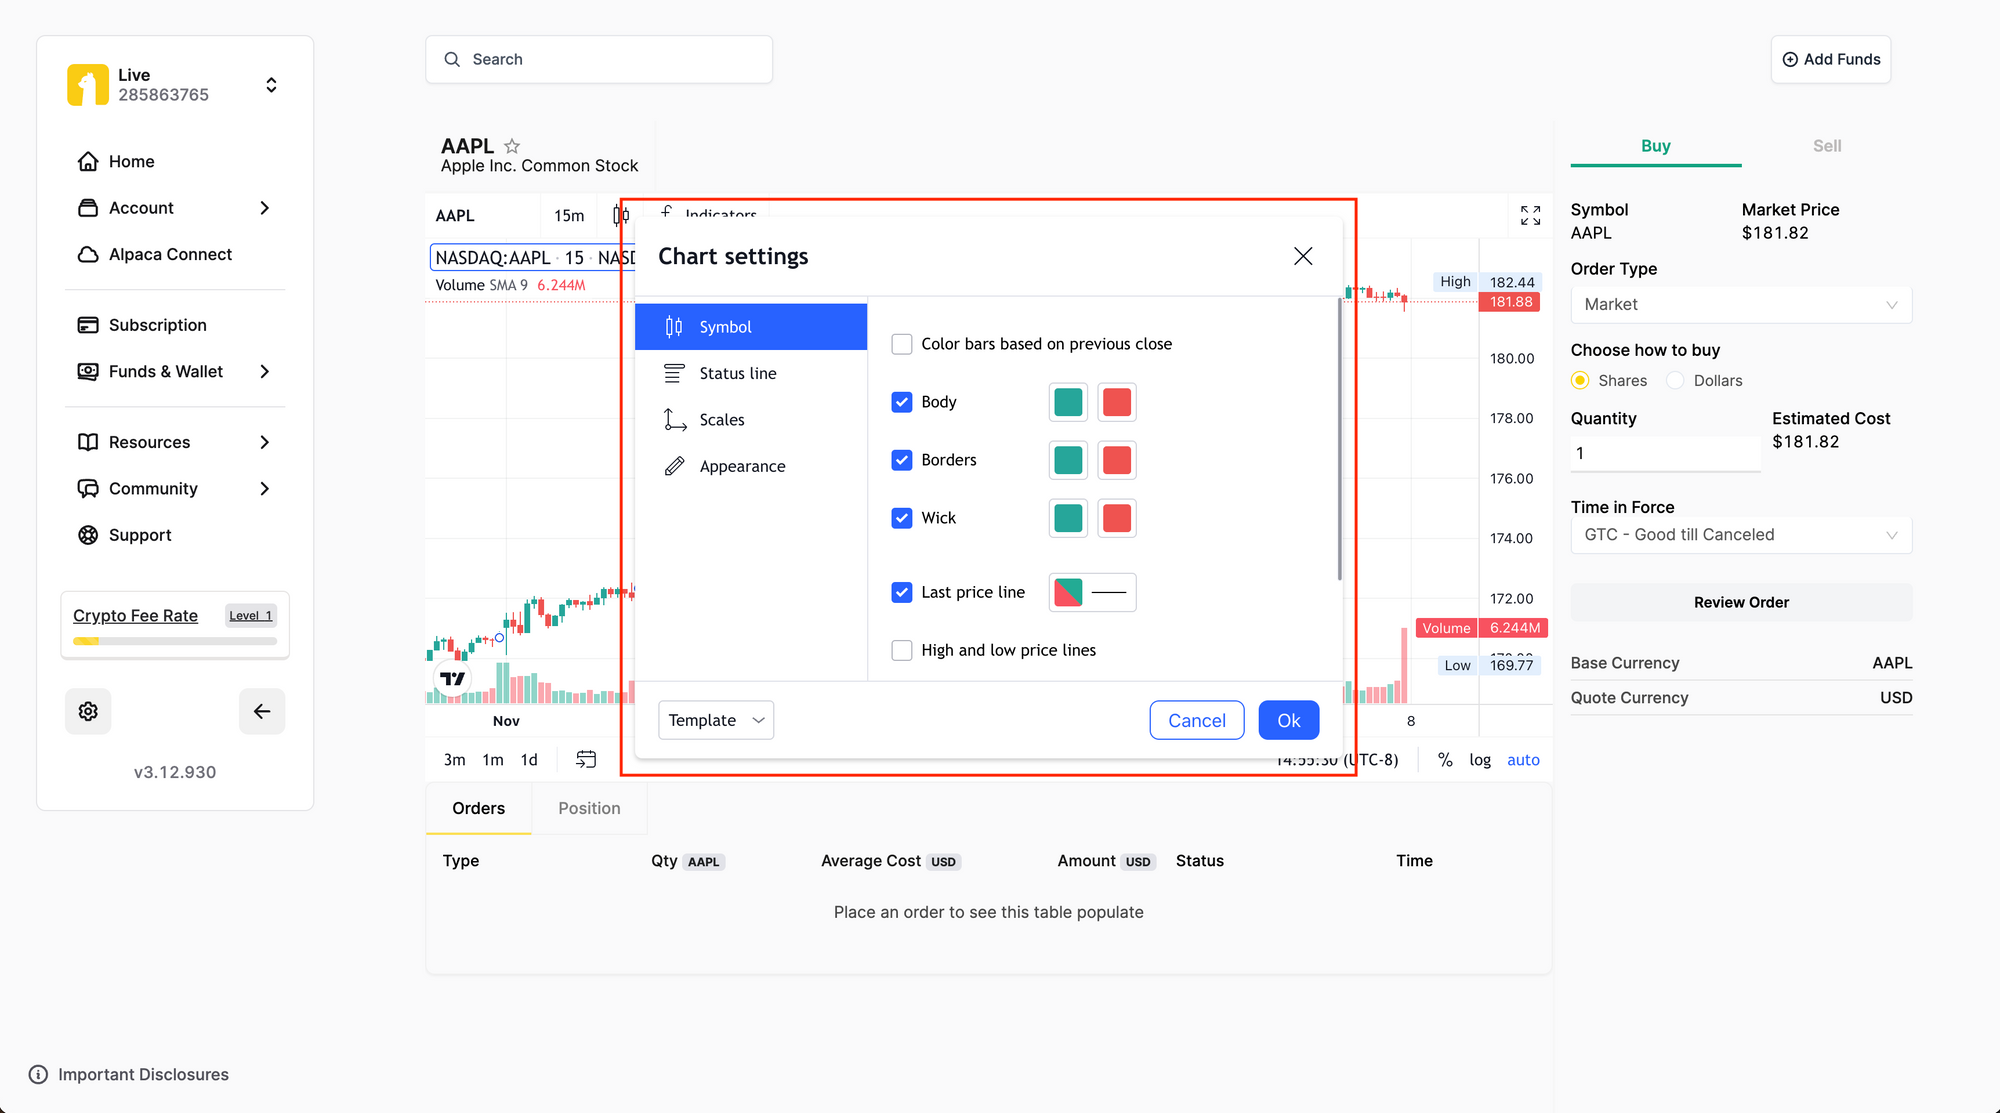
How to customize chart properties
You can customize the color of the chart, adjust the price source, change the chart labels, and more in the Chart Properties.
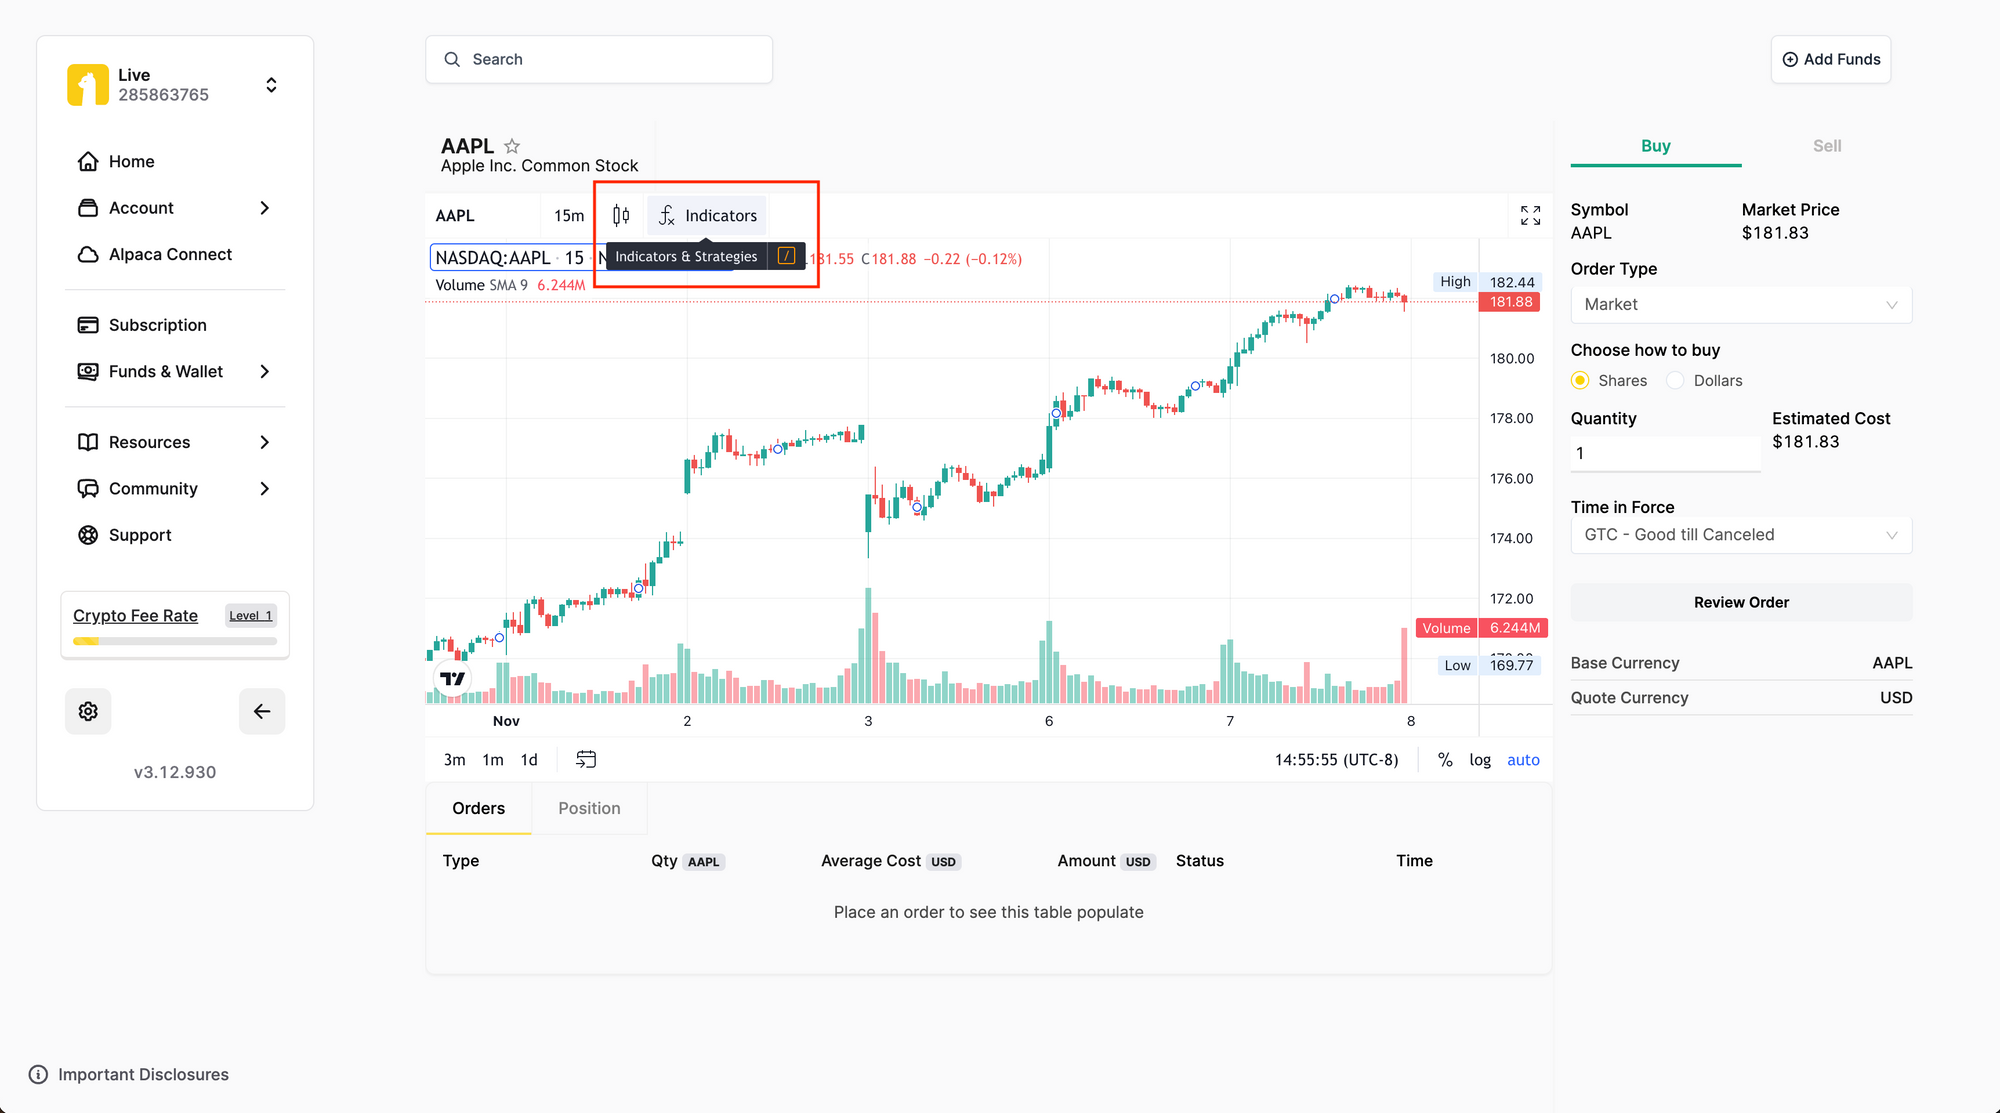
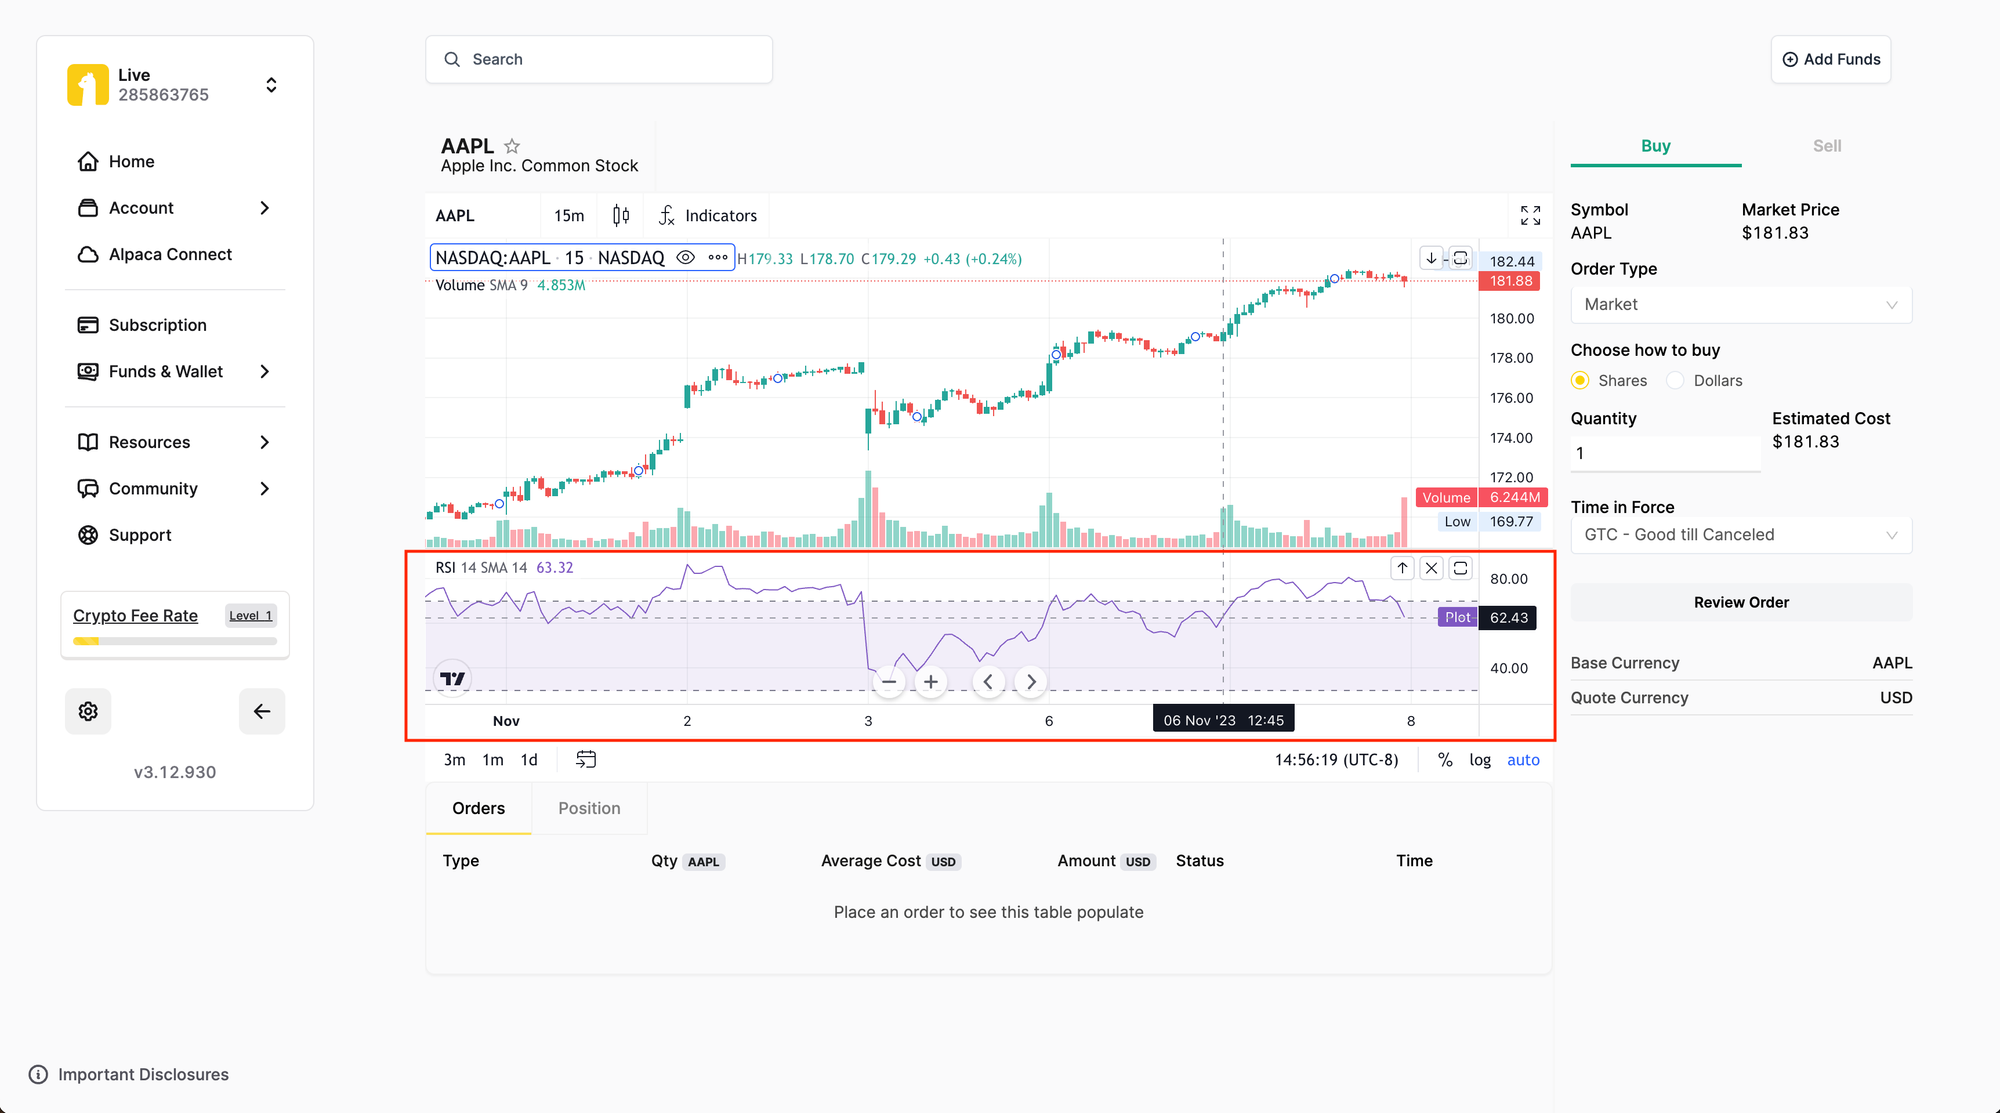
How to add indicators to the chart
You can choose from multiple indicators including Relative Strength Index and Moving Average.
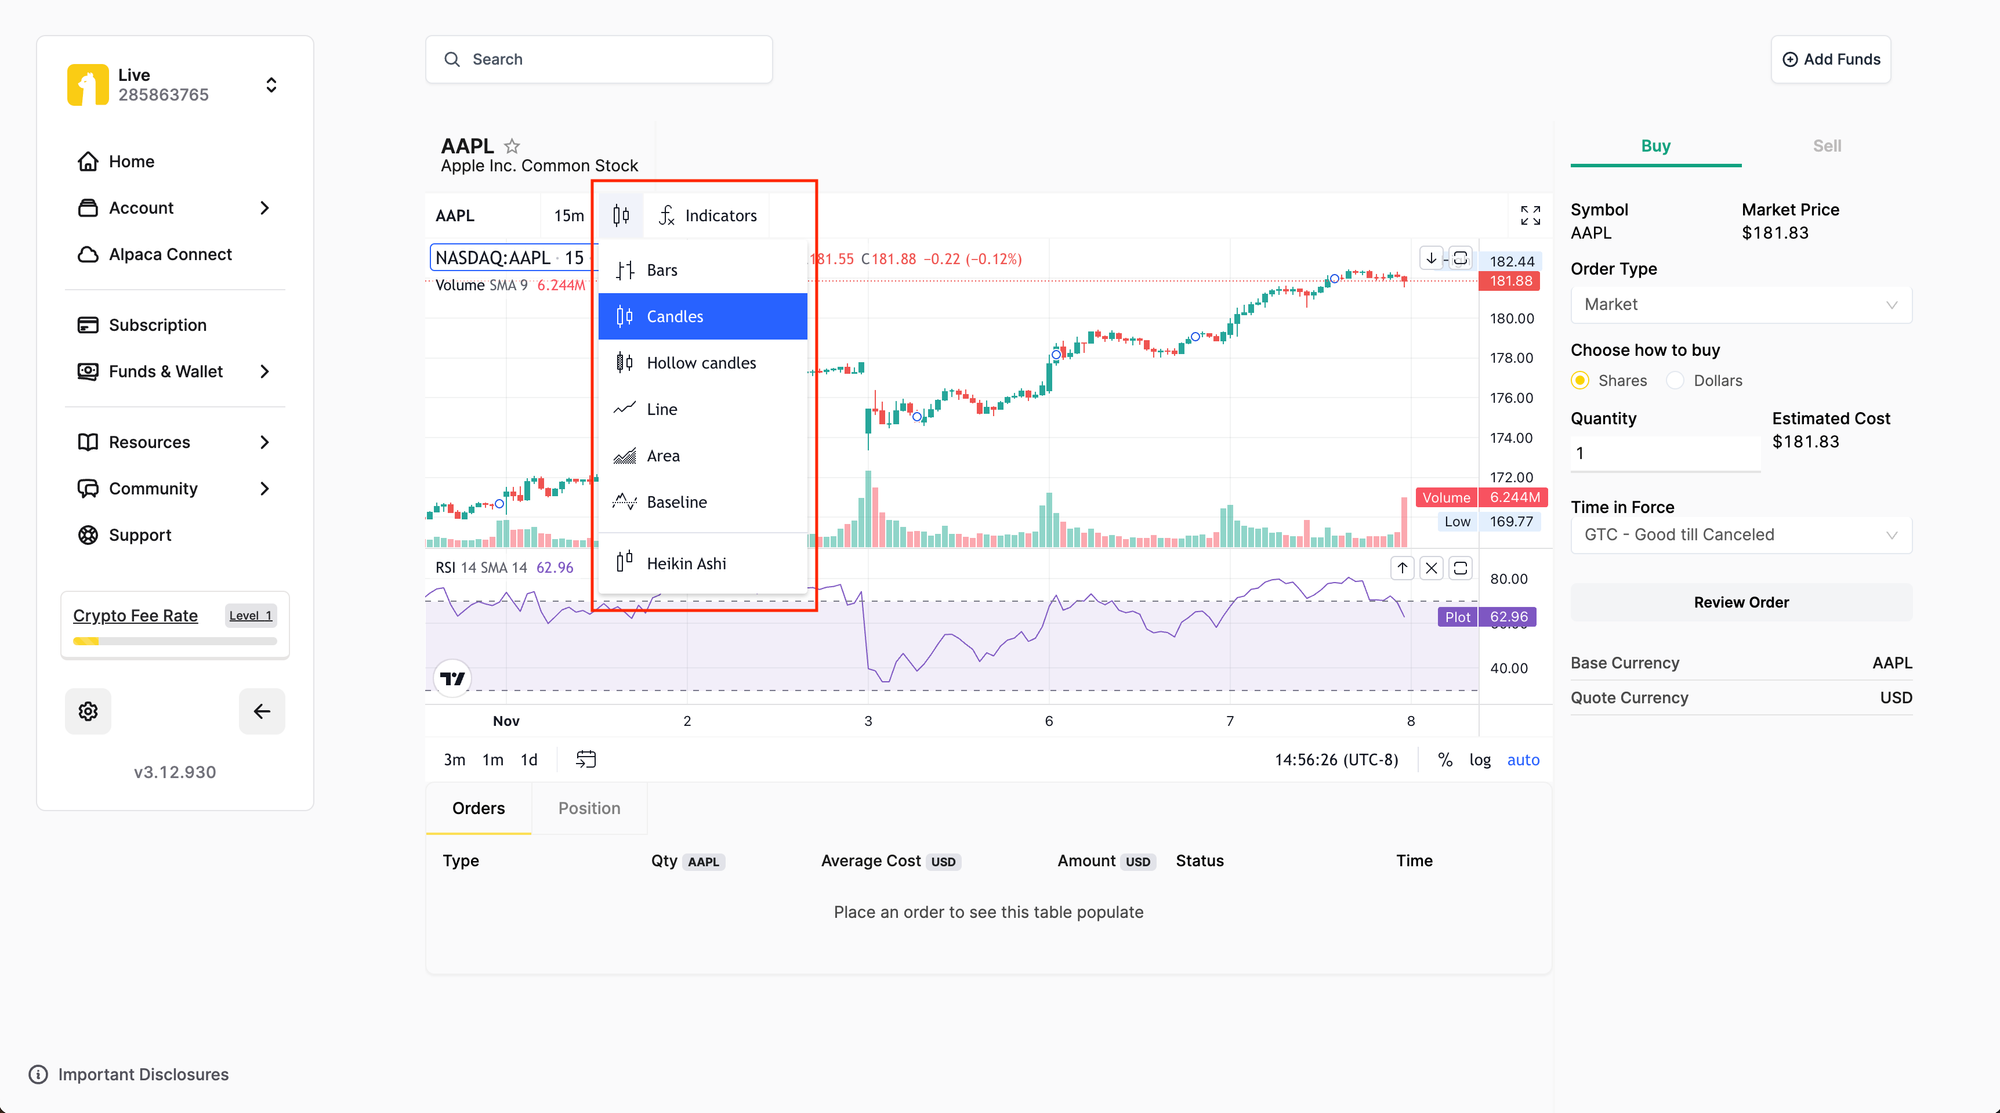
How to customize the chart type
You can easily change the style of your chart by clicking the chart styles button.
Coming soon
In the coming weeks, Alpaca plans to roll out new feature updates that will expand on the current capabilities of TradingView’s advanced charting with Alpaca’s real-time market data integration. The upcoming features will add new functionality to the Alpaca trading dashboard by enabling the ability to place fractional orders, ability to place advanced order types like trailing stop orders, and second-level aggregate bars for deeper insights.
Support
We’re here to help with a global support team. Speak to a member of our support team anytime, from anywhere around the world. For more assistance, please reach out to [email protected].