Intro
In this article, we will go through an example of a pairs trade and show how we can use the Alpaca API to execute our strategy.
 Alpaca
Table of Contents
1). What Is Pairs Trading?2). Why should I run a pairs trading strategy?3). Why shouldn’t I run a pairs trading strategy?4). How do I get started with Alpaca?5). How to code a pairs trading strategy with the Alpaca API?6). How do we size our trades?7). How do I set a stop loss or take profit?8). How can I build a successful pairs trading strategy?What is Pairs Trading?
Pairs trading is a strategy that involves simultaneously selling one asset while buying another. It is a form of arbitrage called statistical arbitrage, or stat arb for short.
Traditional arbitrage is where a trader looks for a price gap in the same asset. As an example, a stock on a US exchange could be trading cheaper than the same stock on a Canadian exchange (after adjusting for the exchange rate of course).
In this case, a trader could buy the US stock and short sell the Canadian stock and then wait for the price gap to close to collect a tidy profit.
Pairs trading follows the same concept. The difference here is that two different assets are traded rather than the same asset.
The crucial component of pairs trading is finding two assets that have very similar price swings.
The chart below is a good example of a pair that shows the type of price behavior suitable for a pairs trade.

The chart tracks two ETFs, ENZL and EWA. ENZL tracks a popular index in New Zealand while EWA follows an Australian index.
Both assets appear to move in tandem for the most part but diverge from time to time. We will be looking to make trades to take advantage of these price inefficiencies in anticipation of a reversion to the mean.
On a personal note, I (Jignesh) have been trading the markets for over 8 years. During that time, I’ve had the opportunity to evaluate many different trading strategies. I personally put pairs trading high on my list of preferential trading strategies and much prefer it to strategies that rely on purely directional trading.
If you like strategies like pairs trading as much as I do, and are looking for more inspiration, check out the AlgoTrading101 blog where I regularly write algorithmic trading guides.
 -Michael Laurenson, 5 Stars
Why should I run a pairs trading strategy?
An advantage of a pairs trading strategy is that it vastly reduces your exposure to normal market swings. If the markets move sharply lower, chances are you'll make up for the loss on the long leg of the pairs trade with the gain made on the short leg.
Also consider that Alpaca has opened up the opportunity in this space for retail traders. A lot of arbitrage strategies involve small spreads that can only be traded by institutions as they don't pay retail commissions. But since Alpaca offers commission-free trading, this is no longer a hurdle for retail traders.
Why shouldn't I run a pairs trading strategy?
On paper, pairs trading looks great. But there are some things to be aware of. A big one is that it's not always easy to find suitable stocks for a strategy. The first part is finding two stocks that move closely together. But then the stocks also need to deviate from each other from time to time to present a trade opportunity.
Another thing to be mindful of is that pairs trading can provide a false sense of security. A good pairs trade can give the impression of consistency and low risk.
But it's not unusual to see the relationship between two assets suddenly change. An example of this is the correlation between gold and equities. For a long time, they've moved opposite of each other. But as of the summer of 2019, they've had a positive correlation.
Since things can change quickly in the markets, it's always a good idea to use a stop loss. We'll show how to do that a little further on in the article.
How do I get started with Alpaca?
We will be using Alpaca's Python library to code our strategy.
 alpacahq
The easiest way to install it is by using pip.
pip3 install alpaca-trade-apiThe next step is obtaining your Alpaca API keys and determining how to store them. You can get the keys by logging on to your Alpaca account dashboard. There will be a box on the upper left-hand side of the page which allows you to view your keys.
A common method is to save your keys as environment variables. This way, in case you publish your code somewhere like GitHub, there's no chance of accidentally revealing your keys.
The library will automatically check the environment for various variables. The following link will detail which variable names to use - Alpaca Environment Variables
alpacahqIf you'd like more detailed instructions on obtaining your API keys from Alpaca and how to store them as environment variables, check out the step-by-step Alpaca Trading API guide on the AlgoTrading101 blog.
The article also has detailed instructions for other aspects of the Alpaca API such as firing orders and getting data.
How to code a pairs trading strategy with the Alpaca API?
There are a few basic steps in setting up our pairs trading strategy.
First, we will need to establish a connection to the Alpaca server, grab some historical data, and set up a WebSocket for live data.
Then we will make some calculations on our historical data to determine the best time to enter and exit the trade.
Lastly, if the strategy takes a trade, we will monitor it to determine when to exit.
Before getting started, we should note that this pair's trade example is for educational purposes. We don’t recommend that you run this strategy in a live environment. The objective is to shed some light on how a pair’s trading strategy might work using the Alpaca API.
Let's get started with our code.
The first part is our basic setup. We are importing the libraries that we will be using and declaring some URLs needed to instantiate the REST and WebSocket API.
import threading
from time import sleep

import alpaca_trade_api as tradeapi
import pandas as pd

base_url = 'https://paper-api.alpaca.markets'
data_url = 'wss://data.alpaca.markets'
trade_taken = False

# instantiate REST API
api = tradeapi.REST(base_url=base_url, api_version='v2')

# init WebSocket
conn = tradeapi.stream2.StreamConn(
    base_url=base_url, data_url=data_url, data_stream='alpacadatav1'
)
Next is a simple custom function that uses the API to determine when the market opens next. If the market is not open, the script will sleep until it opens.
def wait_for_market_open():
    clock = api.get_clock()
    if not clock.is_open:
        time_to_open = clock.next_open - clock.timestamp
        sleep(time_to_open.total_seconds())
    return clock
We will be using Alpaca's data WebSocket so we need to create a few callback functions. We only need the latest price and we write this data to the last row of a Pandas DataFrame called data_df. This DataFrame hasn’t been created yet, but we will get it to it soon.
# define websocket callbacks
data_df = None

@conn.on(r'^T.ENZL$')
async def on_second_bars_EWN(conn, channel, bar):
    if data_df is not None:
        data_df.enzl[-1] = bar.price


@conn.on(r'^T.EWA$')
async def on_second_bars_ENZL(conn, channel, bar):
    if data_df is not None:
        data_df.ewa[-1] = bar.price


streams = ['T.ENZL', 'T.EWA']
ws_thread = threading.Thread(target=conn.run, daemon=True, args=(streams,))
ws_thread.start()
The WebSocket has been started in a thread and is ready to start streaming price data.
Now that we've instantiated the REST API class and started the WebSocket, we are ready to move on to the main part of our script.
One main loop is used so that the script can run continuously (perhaps on a server) without needing to stop and restart it as the market opens or closes. There are also a few nested loops that we will get to later on that take care of specific tasks like validating a trade entry or determining when to exit.
while True:

    clock = wait_for_market_open()

    ewa = api.get_barset('EWA', 'day', limit=25)
    enzl = api.get_barset('ENZL', 'day', limit=25)
The first thing we will do is call our custom function that will wait for the market to open. Once the market is open, we can query for historical daily bar data for both the stocks in our pair trade.
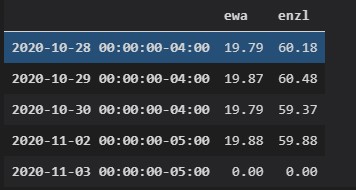
We will be checking the last 20 days to see what the maximum divergence has been over that period. A nice feature of the Alpaca library is that it will automatically attach a Pandas DataFrame to the object that's returned when we query for historical data. This is what our DataFrame looks like for EWA.

We are only interested in the closing prices and want to be able to compare the closing prices between EWA and ENZL. We can use the concat() function from the Pandas library to create a new DataFrame with only this data.
data_df = pd.concat(
        [ewa.df.EWA.close, enzl.df.ENZL.close],
        axis=1,
        join='inner',
        keys=['ewa', 'enzl'],
    )
    data_df.enzl[-1] = 0
    data_df.ewa[-1] = 0
The new DataFrame is called data_df and this is what it looks like if we just print the tail.
Recall that we used the data_df variable earlier in the code under the WebSocket section? By default, the Alpaca API will return today's candle even though it is not closed.
We won't be using today's candle in our spread calculations as it's incomplete. Instead, we will have the Websocket constantly update today's price on the last line of the DataFrame. This will simplify the calculations we will be making to determine our entry later on.
For now, we've overwritten the price to zero. That way we can do some simple error checking to make sure the WebSocket is working before checking for trades.
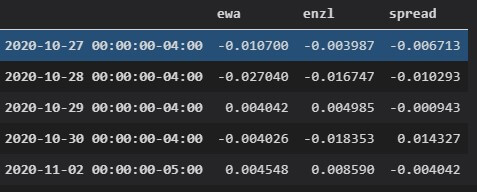
Next we do our spread calculations. The first step is converting the entire DataFrame to show daily percentage changes. Then we can subtract the values from one stock (EWA) from the other (ENZL) to show how much they diverged. Lastly, we take the maximum absolute divergence over the last 20 days and save it as a variable.
Note that we've removed the last line of the DataFrame so that the incomplete data is not included in our spread calculation.
spread_df = data_df.pct_change()
    spread_df = spread_df[:-1]
    spread_df['spread'] = spread_df.ewa - spread_df.enzl
    max_divergence = spread_df.spread.tail(20).abs().max()
This is what our spread_df looks like if we just print the tail.
If we plot the spread, we can see that it does resemble a stationary time-series.
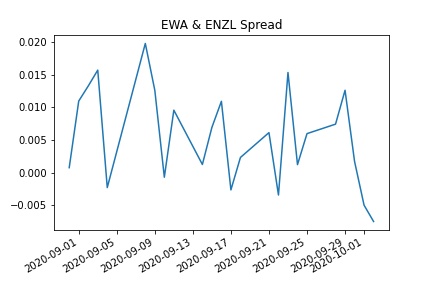
Lastly, before jumping into the next section of our code, we run a quick check to see if the WebSocket has started updating prices.
while data_df.enzl[-1] == 0 or data_df.ewa[-1] == 0:
        sleep(1)
If the WebSocket is updating prices, we can move on and see if the current divergence is greater than the maximum divergence that we calculated.
We only need the last 2 lines of our data_df DataFrame that show yesterday's closing price and the current prices. The same method as before can be used to check the spread. If the current absolute spread is larger than the maximum divergence determined earlier on, we can enter into a trade.
 while not trade_taken:
        # main check for trade
        spread_df = data_df.pct_change()[:2]
        spread_df['spread'] = spread_df.ewa - spread_df.enzl
Before entering into a trade, we need to determine the correct position size for each asset and also calculate our take profit and stop loss. We will discuss these aspects in more detail later in the article.
 if abs(spread_df.spread[-1]) > max_divergence:
            # there is a trade - calculate position sizing
            acct = api.get_account()
            acct_size = float(acct.equity)
            ewa_size = round(acct_size / data_df.ewa[-1])
            enzl_size = round(acct_size / data_df.enzl[-1])

            if spread_df.spread[-1] < 0:
                # EWA - ENZL is negative -> Long EWA short ENZL
                long_ewa = True
                ewa_side = 'buy'
                enzl_side = 'sell'

            else:
                # EWA - ENZL is positive -> Short EWA long ENZL
                long_ewa = False
                ewa_side = 'sell'
                enzl_side = 'buy'

            # submit order
            api.submit_order(
                symbol='EWA',
                qty=ewa_size,
                side=ewa_side,
                time_in_force='gtc',
                type='market',
            )

            api.submit_order(
                symbol='ENZL',
                qty=enzl_size,
                side=enzl_side,
                time_in_force='gtc',
                type='market',
            )

            trade_taken = True
            stop_loss = acct_size * 0.02 * -1
            take_profit = acct_size * max_divergence
            break

        sleep(1)

        # check if the market is still open
        if pd.Timestamp.now(tz='America/New_York') > clock.next_close:
            trade_taken = False
            break
If a trade is taken at this point, we set the trade_taken variable to True and break from this loop. Otherwise, the script will sleep for 1 second and return to the start of the loop to continue monitoring for an entry.
There is also a quick check here to see if the market is still open. If the market is closed, we can break out of this part and return to the start of the main loop. Recall that the first line calls our custom function that puts the script to sleep until the next market open.
We move on to the final section of the script that handles what to do once a trade gets taken. Here we check to see our running PnL and exit the trade if either the stop loss or take profit gets hit.
while trade_taken:
        # In a trade - check for exit
        pnl = data_df.ewa[-1] * ewa_size - data_df.enzl[-1] * enzl_size

        if not long_ewa:
            pnl *= -1  # inverse the p&l calculation

        if pnl < stop_loss or pnl > take_profit:
            # Either stop or take profit hit - close trade
            api.close_position('EWA')
            api.close_position('ENZL')
            trade_taken = False
            break

        if pd.Timestamp.now(tz='America/New_York') > clock.next_close:
            break
Once again, we have an IF statement to check and make sure the market is still open. If not, it will break out and restart from the top and go to sleep until the next market open.
Since the trade_taken variable has been set to True at this point, it won't run through the section that checks for trade entries when the market reopens. Instead, it will go right back to the trade_taken loop to check for exits.
How do we size our trades?
When positioning in a pairs trade, both sides of the trade should be equally weighted in dollars. If both assets had the same price that would be straight-forward.
For example, if stock ABC traded at $20 and stock XYZ traded at $20, we can just long 1000 shares of ABC and short 1000 shares of XYZ. We'd then have $20,000 worth of long exposure and $20,000 worth of short exposure.
In the case of EWA and ENZL, the two assets are not priced the same. EWA trades at roughly $20 and ENZL trades at $60. That means we need to short 3 shares of EWA for every 1 share of ENZL that we get long.
In other words, we would short 1000 shares of EWA and long 333 shares of ENZL (1000/3). We derive this by taking the amount we want to invest and dividing it by the share price.
EWA -> $20,000 / $20 (share price) = 1000
ENZL -> $20,000 / $60 (share price) = 333
Here is what our position would look like:
Short EWA 1000 shares @ $20 per share: -$20,000
Long ENZL 333 shares @60 per share: $19,980
If EWA rose by 5% after we took the trade, and ENZL rose by 6%, this is what our PnL would look like:
EWA Loss: $1000 (0.05 x 2000)
ENZL Gain: $1199 (0.06 x 19980)
Net Profit: $199 (Gain of $1199 - Loss of $1000)
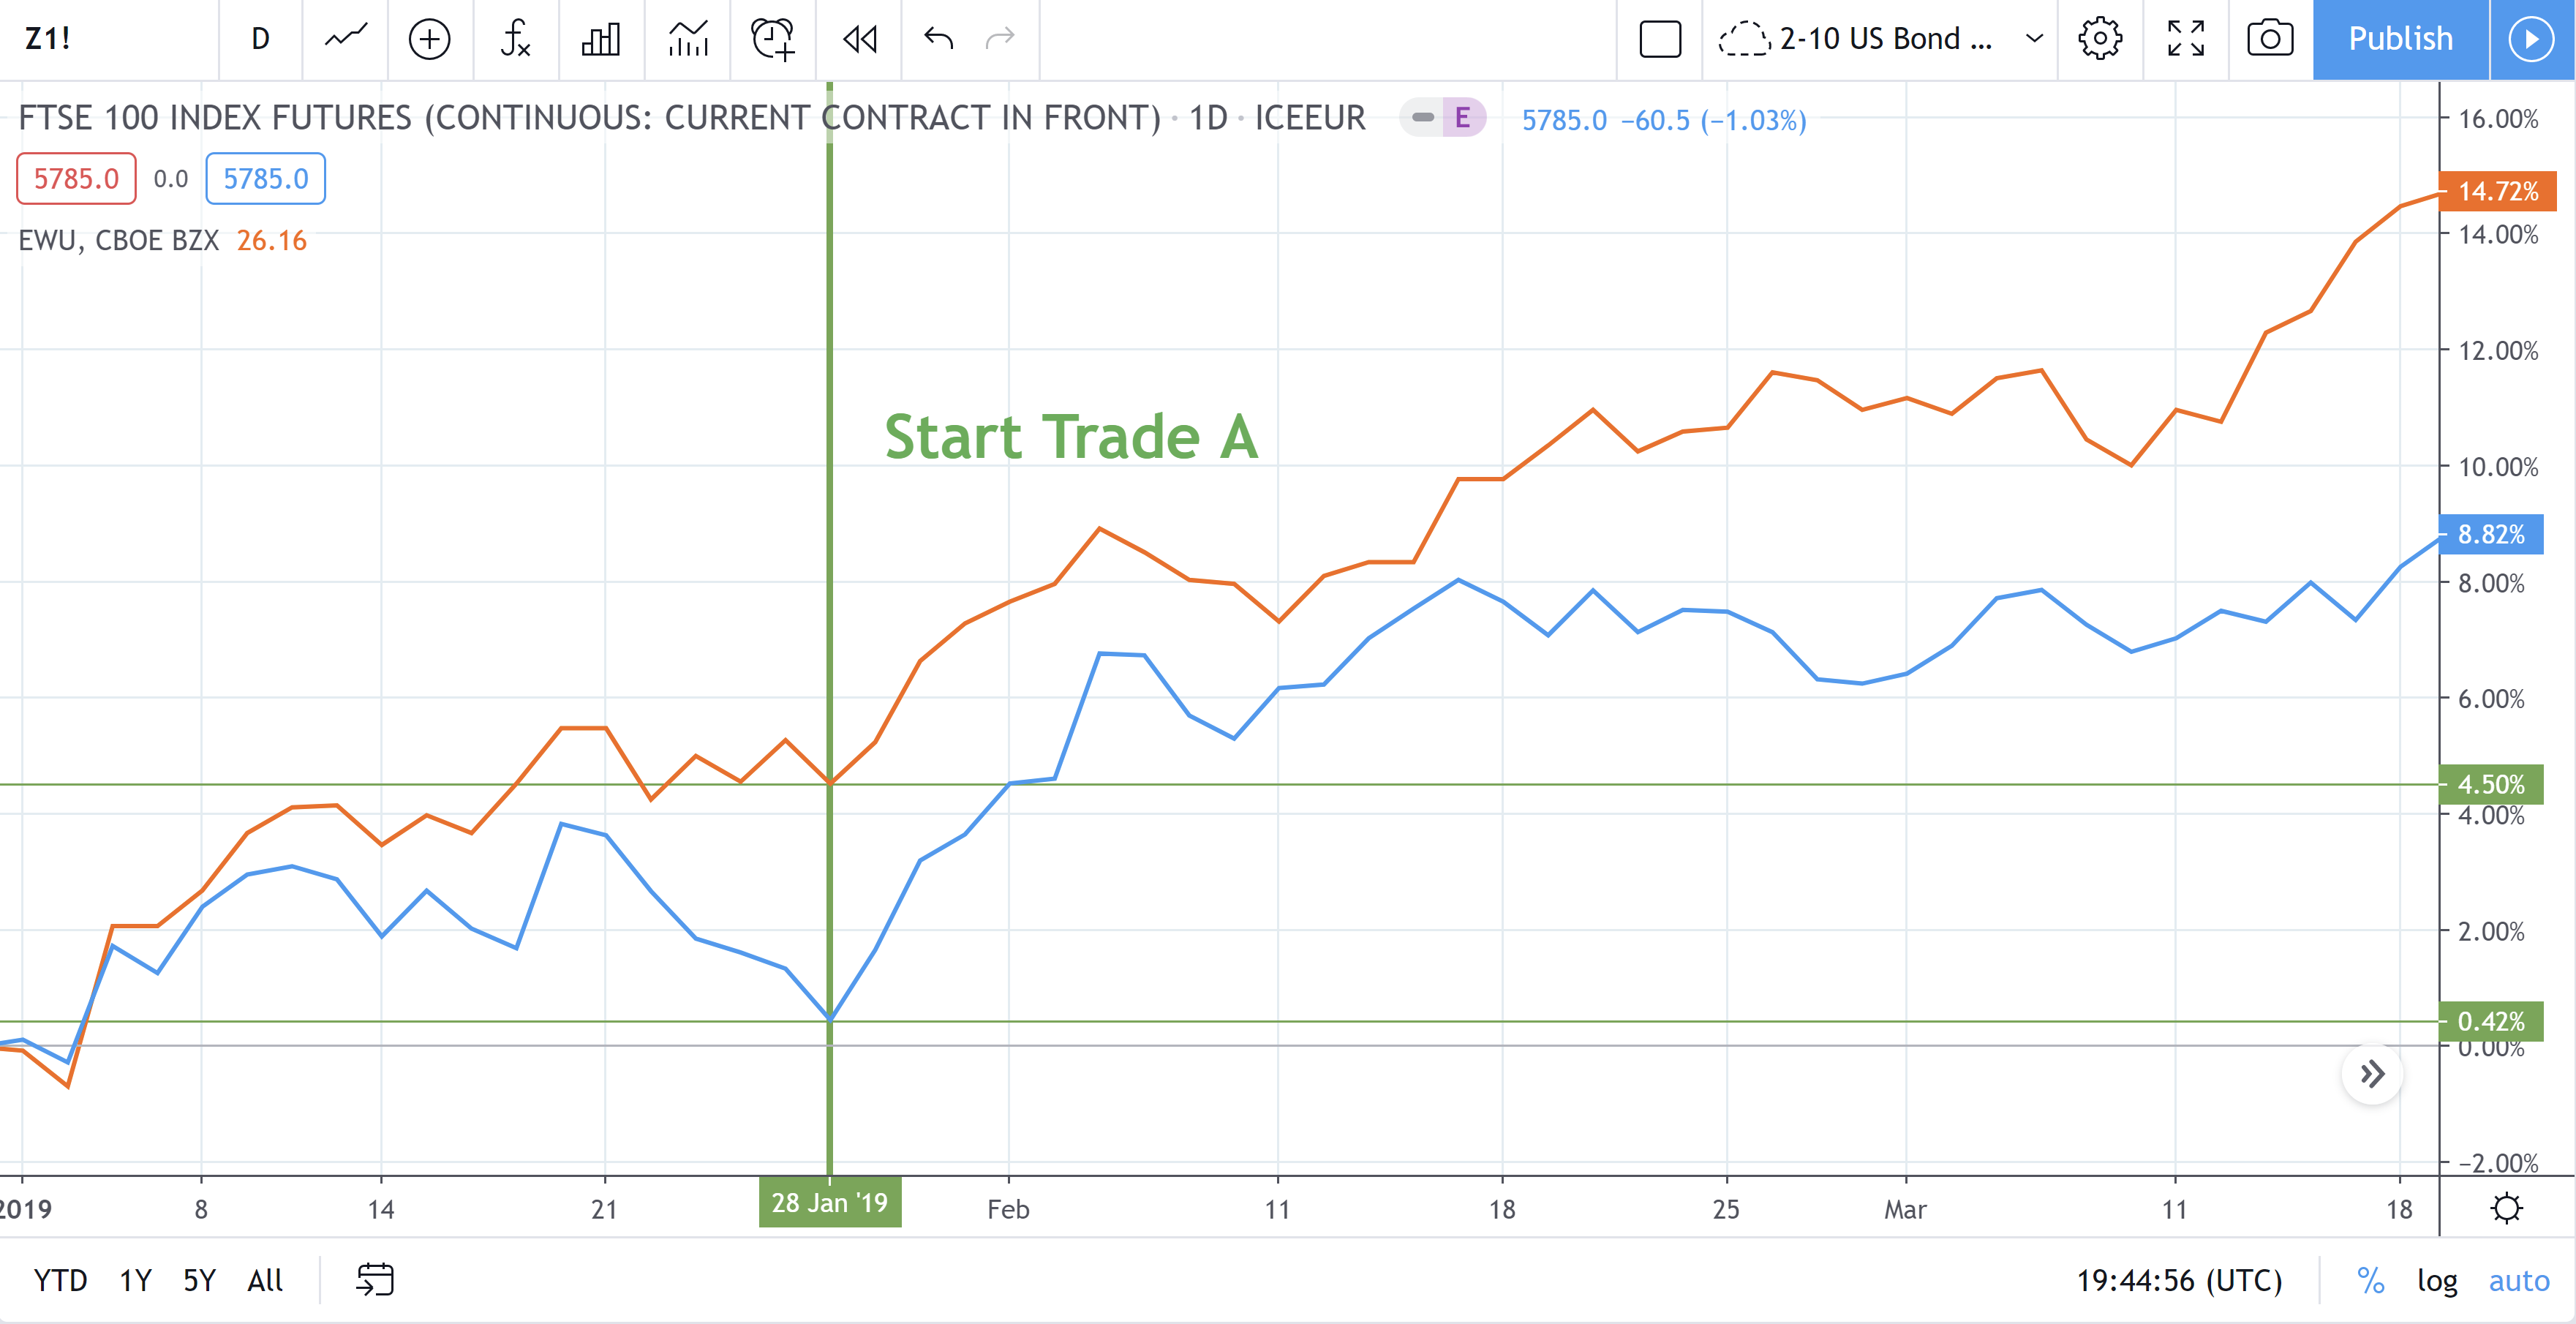
There are other ways to size positions, depending on your strategy. One alternative is to size positions based on the Beta of the stock.
/94177589-5bfc2b9546e0fb00265bec64.jpg)
The idea here is that if the Beta between two stocks is different, it would make sense to have a larger weight in the lower Beta stock and smaller weight in the higher Beta stock. If the goal is to match Beta’s, this should be taken into account when choosing the right assets for the pairs trade and the method to make spread calculations.
Another approach is targeting the maximum potential loss. In our example, we know that the average deviation in the spread is a bit under 2%. We also want to limit our loss to 2% of our account size.
That means we can use our full account size on our long leg and rely on leverage to fund the short leg. This way, if the spread goes against us by 2%, we can close the trade and the loss will equate to 2% of our account size. If we only wanted to risk 1% of our account size, then we would have allocated half our account balance to the long leg.
Lastly, position sizes can be based on correlation. If you have two stocks that move similarly, but one stock consistently outperforms the other as an example, the weighting can be adjusted to manipulate the spread into a stationary time-series.
How do I set a stop loss or take profit?
In pairs trading, we can't set a static stop loss or take profit. If we set a stop loss of 2% from the current price for both stocks, there could be a scenario where both stocks fall 2%. In that case, our gain on one stock would offset the loss on the other which is no reason to exit.
We want to stop out of the trade only if our PnL declines by 2% of our account size.
To track our PnL, we will continue to monitor incoming WebSocket data and use the following formula to calculate our PnL.
(ENZL price * number of shares) - ( EWA price * number of shares)
Recall that we are long ENZL and short EWA in this example. That means if the result of the above equation is positive, we are in profit. If it is negative, we have a loss.
Rather than using the above equation, we could also poll the API using the get_position() function to figure out our PnL. However, using a WebSocket is a better practice than continuously querying the API.
How can I build a successful pairs trading strategy?
We hope this article has inspired you to look at developing your own pairs trading strategy.
If you're looking for tips on designing your pairs trading strategy, the following link has a lot of useful information- Pairs Trading - A Real-World Guide.
It goes into more detail about which asset types work best, different methods to assign weights to your pairs, and also discusses certain things to avoid to help you in your strategy creation.
The full strategy which this tutorial referenced can be found on the following GitHub repository:
PythonForForex
About AlgoTrading101
AlgoTrading101 is an Investopedia-recommended online algorithmic trading course with over 30,000 members.
We don’t promise any “working strategies”. Our aim is to provide the necessary mental models, trading knowledge and quantitative skills to succeed as a trader.
You can check us out here: AlgoTrading101 Course
 -Michael Laurenson, 5 Stars
Commission-Free trading means that there are no commission charges for Alpaca self-directed individual cash brokerage accounts that trade U.S. listed securities through an API. Relevant SEC and FINRA fees may apply.
Technology and services are offered by AlpacaDB, Inc. Brokerage services are provided by Alpaca Securities LLC (alpaca.markets), member FINRA/SIPC. Alpaca Securities LLC is a wholly-owned subsidiary of AlpacaDB, Inc.
You can find us @AlpacaHQ, if you use twitter.