Level 2 data streaming is now available on Alpaca Crypto API for more than 20 coins. Level 1 data previously contained the best bid and ask, which offered a quick look into what the market is pricing an asset. But with level 2 data, the collection of quotes goes beyond the best bid and ask, enabling you to better analyze market structure and make more informed decisions.
Let’s try to understand level 2 data through visualization. A common method for visualizing level 2 data is by charting it. But these methods fail to capture the dynamic nature of the orderbook. Instead, we will create a GIF that shows how the orderbook evolves over time.
Getting Started With Alpaca
To follow along, you need a set of API keys from Alpaca. First, sign up for a paper trading account at https://app.alpaca.markets/signup. Then install the alpaca-trade-api SDK using pip
pip install alpaca-trade-api
With our API keys, we can now get started with accessing level 2 data.
What is Level 2 Orderbook Data?
To understand level 2 data, we need to understand level 1 data. Level 1 data are the best bid and best offer for an asset. This best bid and offer (BBO) can be on a single exchange or across multiple exchanges depending on your data provider. On Alpaca, you can specify whether you want the BBO across multiple exchanges or for a single exchange using the XBBO endpoint. Level 1 market data offers relatively shallow information about the market, including the lowest ask and highest bid. Level 2 data, however, offers much more information.
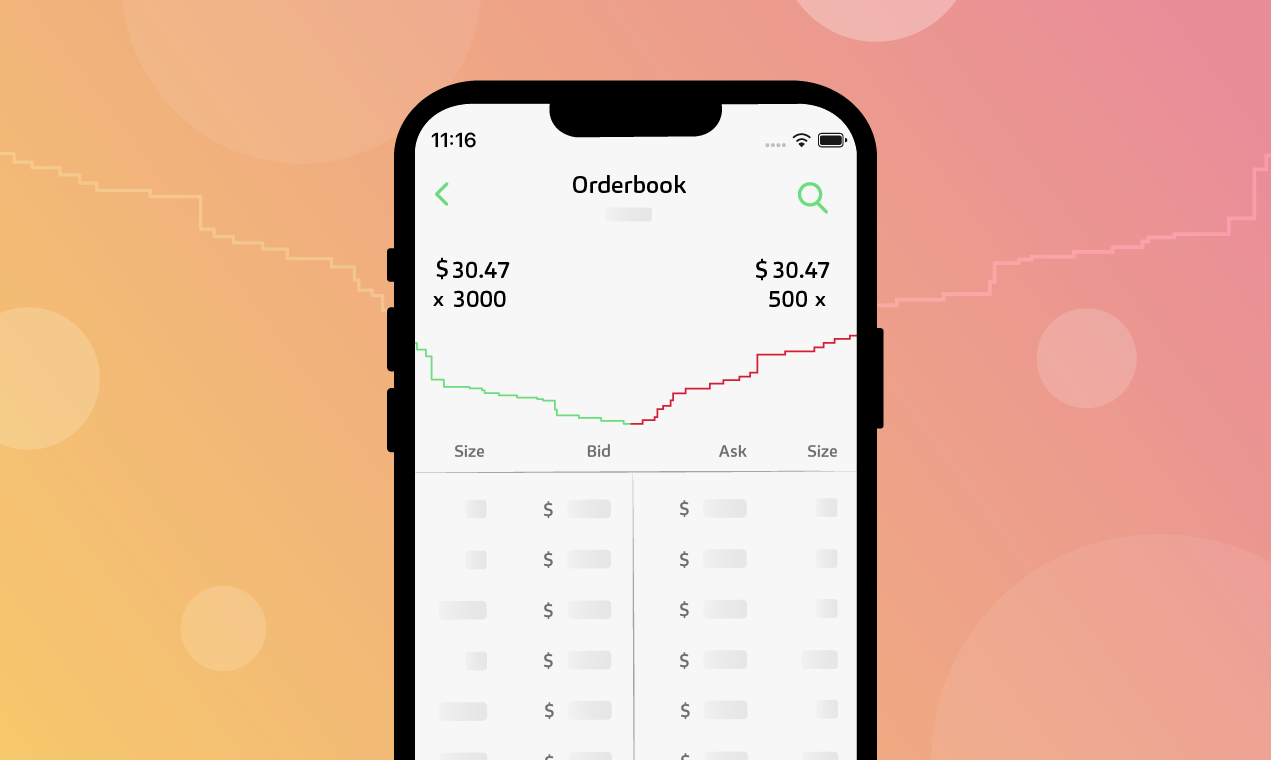
Level 2 data contains multiple bid and ask price levels and their respective quantities. It allows you to look deeper into how investors are pricing the underlying asset beyond the most shallow quotes. Below is a chart of level 2 data of some unknown asset. The chart shows the cumulative quantity of bids and asks. In this example, there are much more being bid for than being offered.

Accessing Orderbook Data
We can stream live orderbook data for cryptocurrencies through Alpaca. Using the alpaca-trade-api SDK, let’s create an instance of the Stream class. The Stream class contains methods that allow us to subscribe to live data types like bar, level 1 quote, and level 2 orderbook data.
import matplotlib.pyplot as plt
from alpaca_trade_api.stream import Stream

API_KEY = "YOUR API KEY"
SECRET_KEY = "YOUR API SECRET KEY"
Stream_client = Stream(API_KEY, SECRET_KEY)
For live data streaming, create an asynchronous callback function to handle data as they arrive. Let’s define an async method called handler which will take 1 parameter for the live orderbook data. For now, our handler method will simply print the data.
async def handler(data):
	print(data)
To subscribe to orderbook data, we need to use the method subscribe_crypto_orderbooks while passing in our handler function and the coins we want data for. Let’s subscribe to orderbook data for Etherum.
stream_client.subscribe_crypto_orderbooks(handler, "ETHUSD")
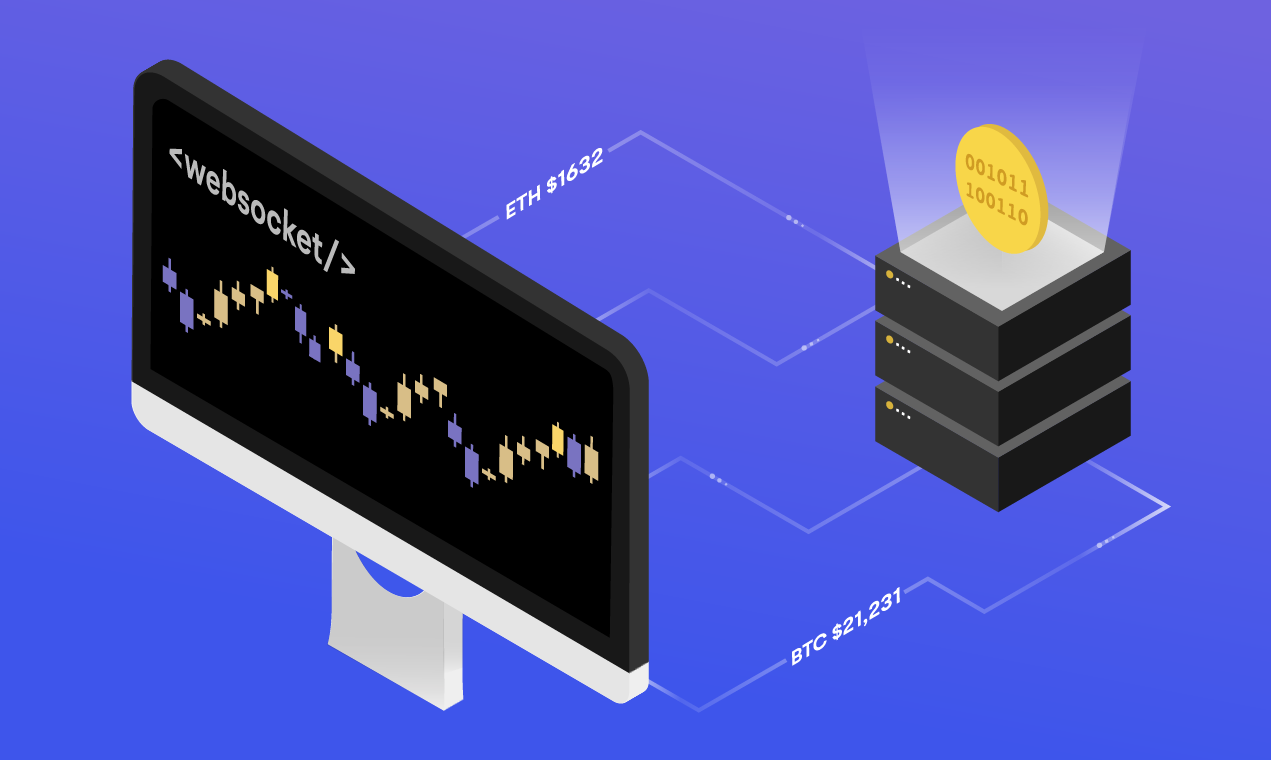
Finally, call the run method to start our streaming of data. This will open a websocket connection with Alpaca’s API and pass all arriving data into our callback function handler.
stream_client.run()The response will be wrapped in an OrderbookV2 object containing information to construct the Orderbook. The first item will always be the current state of the orderbook for a given exchange. Subsequent items will only contain updates. This method of messaging minimizes the amount of data we need to query to have a full picture of the orderbook. Keep in mind, when all the quotes are empty at a price level, we will get an update for 0 size at that price from the API. This models orders leaving the book.
We can keep a local model of the orderbook and update it as we receive messages from the API.
OrderbookV2({   'asks': [],
    'bids': [BidOrAsk({'p': 3067.75, 's': 1.0})],
    'exchange': 'ERSX',
    'symbol': ETHUSD',
    'timestamp': 1651455483967978637})
Modeling the Orderbook Locally
By using dictionaries, we can model an orderbook easily. We can keep two dictionaries – one for asks and one for bids, containing the price and size pairs that comprise the orderbooks. We will store the price as a key and the corresponding size as its value.
Let’s define two dictionaries bids and asks and add the price and size pairs as we receive them. For each Orderbook update in our handler, we’ll iterate through the asks and bids, and add them to our dictionary.
bids_dict = {}
asks_dict = {}

async def handler(data):

	# We want data from only ERSX
    if data.exchange != "ERSX":
        return

    # Keep track of asks and bids
	for ask in data.asks:
    	asks_dict[ask.p] = ask.s

	for bid in data.bids:
  		bids_dict[bid.p] = bid.s
Now our dictionary model of the orderbook will be updated with the latest data. As new quotes arrive to the book, our dictionary will be populated and as quotes leave, the sizes for those prices will be set to 0.
We can take this local model of the orderbook and try to understand it better. One way to do that is through visualization. However, simple charts like figure 1 can fail to capture the dynamic nature of orderbooks. Instead, let’s create an animation which captures a series of charts into 1 continuous visualization.
Creating an Orderbook Animation
To create our animation, we can use matplotlib charts and stitch them together into a GIF. We will use matplotlib to plot and then save the charts locally. For our purposes, let’s create 1000 snapshots of the orderbook for our GIF. We’ll create a count pointer to keep track of the number of charts we’ve plotted. We’ll add our logic to our async handler method because we want to chart each update to the orderbook we receive.
count = 1

async def handler(data):

    # We want data from only ERSX
    if data.exchange != "ERSX":
        return

    # to modify a variable from an async function, mark it global
    global count
    count += 1

    for ask in data.asks:
        asks_dict[ask.p] = ask.s

    for bid in data.bids:
        bids_dict[bid.p] = bid.s

    ### PREPPING THE DATA BEFORE WE PLOT ###

    # sort the bids by price in descending order (reverse=True)
    sorted_bids = sorted(bids_dict.items(), key=lambda b:b[0], reverse=True)

    # remove all empty quotes (0 size) from the bids
    filtered_bids = [[p, s] for p, s in sorted_bids if s != 0]


    # calculate the cumulative size for bids
    for i in range(1, len(filtered_bids)):
        # add the previous bid's size to the current bid's size
        filtered_bids[i][1] += filtered_bids[i-1][1]

    # separate the bid prices and bid sizes into their own lists
    bid_p = [p for p,s  in filtered_bids]
    bid_s = [s for p,s in filtered_bids]


    # sort the asks by price in ascending order (reverse=False)
    sorted_asks = sorted(asks_dict.items(), key=lambda b:b[0], reverse=False)

    # remove all empty quotes (0 size) from the asks
    filtered_asks = [[p, s] for p, s in sorted_asks if s != 0]


    # calculate cumulative size for the asks
    for i in range(1, len(filtered_asks)):
        # add the previous ask's size to the current ask's size
        filtered_asks[i][1] += filtered_asks[i-1][1]

	# separate the ask price and ask sizes into their own lists
    ask_p = [p for p,s  in filtered_asks]
    ask_s = [s for p,s in filtered_asks]
Then we can plot our price and size pairs on our chart. We’ll use blue for the bids and red for the asks. To add some time context to the data, we can also add in the timestamp of the orderbook. Let’s add it into the title and that way we can just update the title of each chart with the timestamp. Keep in mind that the timestamp from the API is provided in a very precise form and must be divided by 1 Billion (1e9) to get the traditional UNIX timestamp, which we can convert to a UTC timestamp.
def handler(data):
    .....

    .....

    # plotting and saving images

    plt.plot(bid_p, bid_s, color='b')
    plt.plot(ask_p, ask_s, color='r')

	# convert to UTC
    time = datetime.fromtimestamp(data.timestamp/1e9).time()

    # use matplotlib to plot and save the chart
    plt.title(f"Ethereum Orderbook t={time}")
    plt.xlabel("Price")
    plt.ylabel("Size")

    # saves the chart locally
    plt.savefig(f"image_{count}.png")
    plt.clf()

    # once we have 1000 images, we can stop the websocket
    if count > 1000:
        await stream_client.stop_ws()
Once we have our images, we can stitch them together into a GIF using an online tool like https://ezgif.com/maker. For our example, we get the following result.

Conclusion
Level 2 Orderbook data offers a deeper look into the structure of markets. This additional information can be used to create new trading strategies like market making strategies or orderbook imbalance strategies and much more.
Please note that this article is for informational purposes only. The example above is for illustrative purposes only. Actual crypto prices may vary depending on the market price at that particular time. Alpaca Crypto LLC does not recommend any specific cryptocurrencies.
Cryptocurrency is highly speculative in nature, involves a high degree of risks, such as volatile market price swings, market manipulation, flash crashes, and cybersecurity risks. Cryptocurrency is not regulated or is lightly regulated in most countries. Cryptocurrency trading can lead to large, immediate and permanent loss of financial value. You should have appropriate knowledge and experience before engaging in cryptocurrency trading. For additional information please click here.
Cryptocurrency services are made available by Alpaca Crypto LLC ("Alpaca Crypto"), a FinCEN registered money services business (NMLS # 2160858), and a wholly-owned subsidiary of AlpacaDB, Inc. Alpaca Crypto is not a member of SIPC or FINRA. Cryptocurrencies are not stocks and your cryptocurrency investments are not protected by either FDIC or SIPC. Please see the Disclosure Library for more information.
This is not an offer, solicitation of an offer, or advice to buy or sell cryptocurrencies, or open a cryptocurrency account in any jurisdiction where Alpaca Crypto is not registered or licensed, as applicable.