Defining Technical Chart Patterns Programmatically
Ever wondered how to programmatically define technical patterns in price data?
At the fundamental level, technical patterns come from local minimum and maximum points in price. From there, the technical patterns may be defined by relative comparisons in these min/max points.
Let’s see if we could have played this by algorithmically identifying any inverse head & shoulders patterns!
Follow along with the notebook here.

The following code can easily be retooled to work as a screener, backtester, or trading algo, with any timeframe or patterns you define.
Disclaimer: this code is intended as a starting point for finding technical patterns, it is for educational purposes only. The framework for this code came from here.

Step 1.) Read in data
I’m reading in data using the Alpaca API (which I’ll also use to place trades later).
I wrote this function to grab data beyond the one request limit of 2,000 minute bars. Later we’ll resample to our timeframe of choice.
import pandas as pd
from datetime import timedelta

import alpaca_trade_api as tradeapi

api = tradeapi.REST('YOUR API KEY HERE',
                    'YOUR API SECRET CODE HERE',
                    'https://paper-api.alpaca.markets')

def get_data(symbol, lookback):
    all_data = pd.DataFrame()
    for x in range(lookback):
        if x == 0:
            data = api.polygon.historic_agg('minute', symbol, limit=None).df
        else:
            data = api.polygon.historic_agg('minute', symbol, _from = (data.index.min() - timedelta(days=5)).strftime('%x %X'), to = start, limit = None).df
        start = data.index.min().strftime('%x %X')
        end = data.index.max().strftime('%x %X')
        all_data = pd.concat([data, all_data], axis=0)
    all_data.drop(columns=['volume'], inplace=True)
    all_data.dropna(inplace=True)
    all_data = all_data[~all_data.index.duplicated()]
    all_data.replace(0, method='bfill', inplace=True)
    return all_data

data = get_data('CAT', 3)

data
We’ll resample data separately, in case we want to try out different timeframes later.
resampled_data = data.resample('60T', closed='right', label='right').agg({'open': 'first',
                                                                         'high': 'max',
                                                                         'low': 'min',
                                                                         'close': 'last'}).dropna()
resampled_data
Step 2.) Find minima and maxima
For this step we’ll use a function from scipy’s signal processing library to find peaks in the data.
This code looks complicated, but the point is to return the integer index values with price, for each min/max point.
import numpy as np
from scipy.signal import argrelextrema
def get_max_min(prices, smoothing, window_range):
smooth_prices = prices['close'].rolling(window=smoothing).mean().dropna()
local_max = argrelextrema(smooth_prices.values, np.greater)[0]
local_min = argrelextrema(smooth_prices.values, np.less)[0]
price_local_max_dt = []
for i in local_max:
if (i>window_range) and (i<len(prices)-window_range):
price_local_max_dt.append(prices.iloc[i-window_range:i+window_range]['close'].idxmax())
price_local_min_dt = []
for i in local_min:
if (i>window_range) and (i<len(prices)-window_range):
price_local_min_dt.append(prices.iloc[i-window_range:i+window_range]['close'].idxmin())
maxima = pd.DataFrame(prices.loc[price_local_max_dt])
minima = pd.DataFrame(prices.loc[price_local_min_dt])
max_min = pd.concat([maxima, minima]).sort_index()
max_min.index.name = 'date'
max_min = max_min.reset_index()
max_min = max_min[~max_min.date.duplicated()]
p = prices.reset_index()
max_min['day_num'] = p[p['timestamp'].isin(max_min.date)].index.values
max_min = max_min.set_index('day_num')['close']
return max_min
smoothing = 3
window = 10
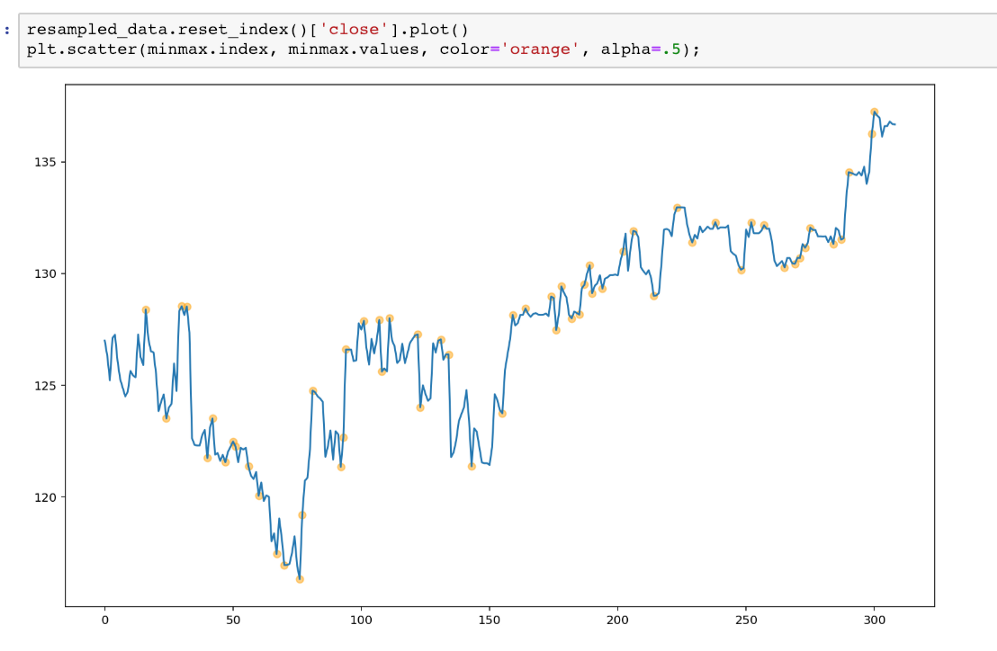
minmax = get_max_min(resampled_data, smoothing, window)
minmaxLet’s plot it with the resampled price data to visually confirm we’re on the right track.
Step 3.) Find patterns
To find patterns, we simply iterate over all our min max points, and find windows where the points meet some pattern criteria.
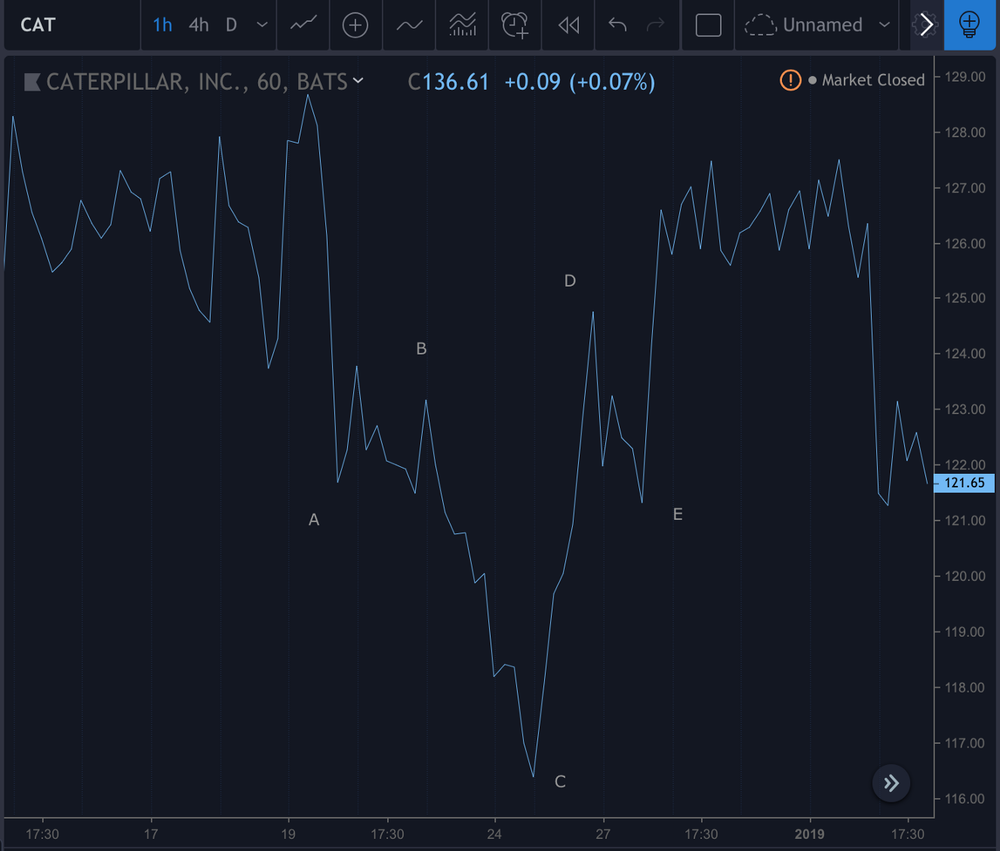
For example, an inverse head and shoulders can roughly be defined as:
C < A, B, D, E
A, E < B, D
To filter for head and shoulders with even necklines:
abs(B-D) < np.mean([B, D])*0.05
(The difference between the necklines must not be more than 5%.)
Here’s the code:
from collections import defaultdict

def find_patterns(max_min):
    patterns = defaultdict(list)

    # Window range is 5 units
    for i in range(5, len(max_min)):
        window = max_min.iloc[i-5:i]

        # Pattern must play out in less than n units
        if window.index[-1] - window.index[0] > 100:
            continue

        a, b, c, d, e = window.iloc[0:5]

        # IHS
        if a<strong and c<a and c<e and c<d and e<d and abs(b-d)<=np.mean([b,d])*0.02:
               patterns['IHS'].append((window.index[0], window.index[-1]))

    return patterns

patterns = find_patterns(minmax)
patterns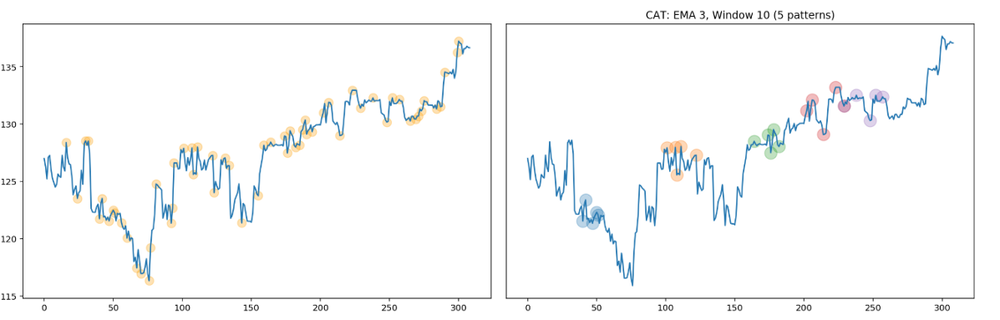
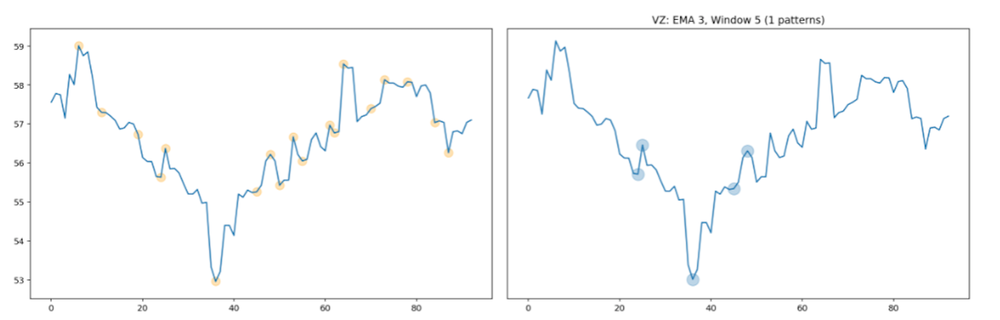
As you can see, we are getting more patterns than we need. Our params (smoothing and window range) are too sensitive for this timeframe (60 minutes).
Step 4.) Reorganize and iterate to find best params
In order to find the best params, I reorganized my code into functions and iterated through multiple stocks, smoothing, and window parameters.
def plot_minmax_patterns(prices, max_min, patterns, stock, window, ema):

    incr = str((prices.index[1] - prices.index[0]).seconds/60)

    if len(patterns) == 0:
        pass
    else:
        num_pat = len([x for x in patterns.items()][0][1])
        f, axes = plt.subplots(1, 2, figsize=(16, 5))
        axes = axes.flatten()
        prices_ = prices.reset_index()['close']
        axes[0].plot(prices_)
        axes[0].scatter(max_min.index, max_min, s=100, alpha=.3, color='orange')
        axes[1].plot(prices_)
        for name, end_day_nums in patterns.items():
            for i, tup in enumerate(end_day_nums):
                sd = tup[0]
                ed = tup[1]
                axes[1].scatter(max_min.loc[sd:ed].index,
                              max_min.loc[sd:ed].values,
                              s=200, alpha=.3)
                plt.yticks([])
        plt.tight_layout()
        plt.title('{}: {}: EMA {}, Window {} ({} patterns)'.format(stock, incr, ema, window, num_pat))

def get_results(prices, max_min, pat, stock, ema_, window_):

    incr = str((prices.index[1] - prices.index[0]).seconds/60)

    #fw_list = [1, 12, 24, 36]
    fw_list = [1, 2, 3]
    results = []
    if len(pat.items()) > 0:
        end_dates = [v for k, v in pat.items()][0]
        for date in end_dates:
            param_res = {'stock': stock,
                         'increment': incr,
                         'ema': ema_,
                         'window': window_,
                         'date': date}
            for x in fw_list:
                returns = (prices['close'].pct_change(x).shift(-x).reset_index(drop=True).dropna())
                try:
                    param_res['fw_ret_{}'.format(x)] = returns.loc[date[1]]
                except Exception as e:
                    param_res['fw_ret_{}'.format(x)] = e
            results.append(param_res)
    else:
        param_res = {'stock': stock,
                     'increment': incr,
                     'ema': ema_,
                     'window': window_,
                     'date': None}
        for x in fw_list:
            param_res['fw_ret_{}'.format(x)] = None
        results.append(param_res)
    return pd.DataFrame(results)

def screener(stock_data, ema_list, window_list, plot, results):

    all_results = pd.DataFrame()

    for stock in stock_data:
        prices = stock_data[stock]

        for ema_ in ema_list:
            for window_ in window_list:
                max_min = get_max_min(prices, smoothing=ema_, window_range=window_)
                pat = find_patterns(max_min)

                if plot == True:
                    plot_minmax_patterns(prices, max_min, pat, stock, window_, ema_)

                if results == True:
                    all_results = pd.concat([all_results, get_results(prices, max_min, pat, stock, ema_, window_)], axis=0)

    if results == True:
        return all_results.reset_index(drop=True)
Run the above like so:
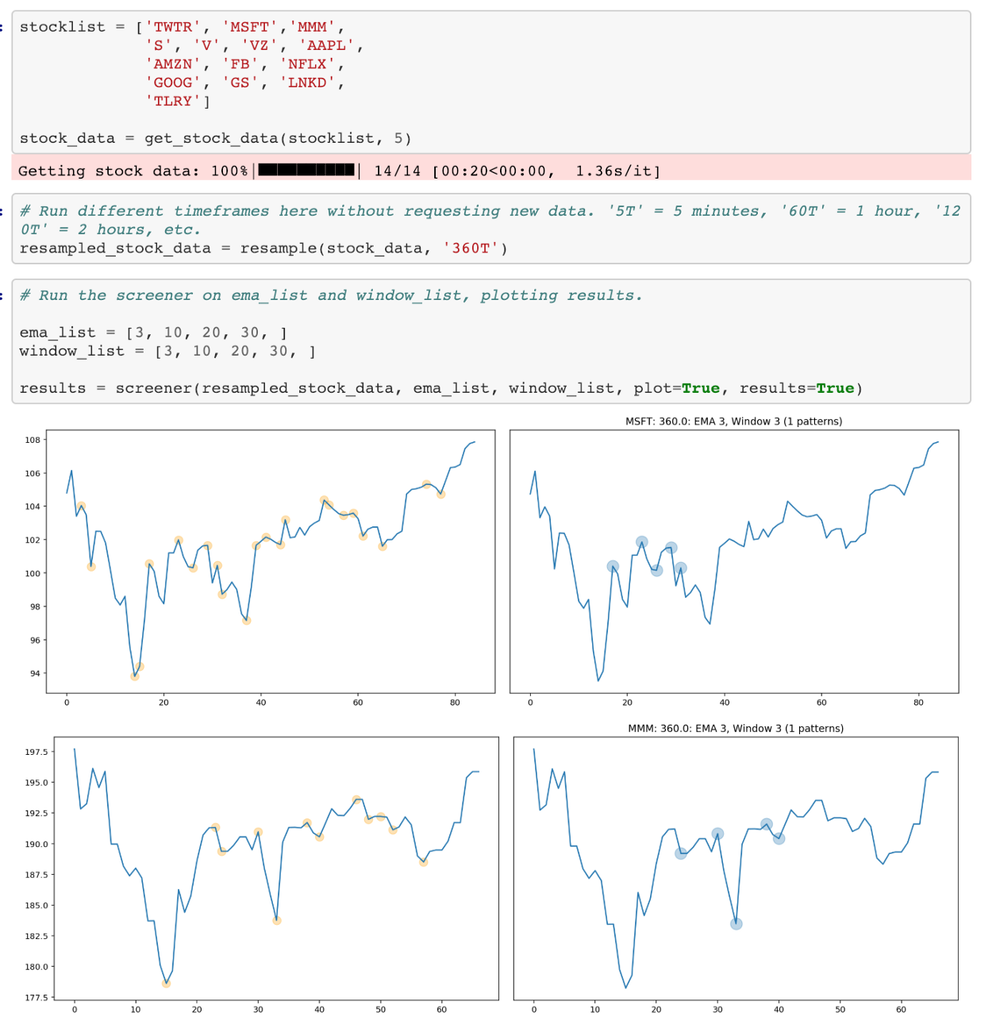
Now we can see how our timeframes, patterns, and params are playing out!
Step 5.) Go live!
To use this live, I made the following changes to screener():
def screener(stock_data, ema_list, window_list):
   triggers = []
 all_results = pd.DataFrame()
   for stock in stock_data:
prices = stock_data[stock]
   for ema_ in ema_list:
            for window_ in window_list:
                max_min = get_max_min(prices, smoothing=ema_, window_range=window_)
                pat = find_patterns(max_min)

                if len(pat) > 0:
                    triggers.append(stock)
                   return triggers
And ran like so:
stocklist = ['AA', 'AAL', 'AAPL', 'AMZN'] # Long list of stocks here
stock_data = get_stock_data(stocklist, 2)resampled_stock_data = resample(stock_data, '360T')
ema_list = [5]
window_list = [5]
results = screener(resampled_stock_data, ema_list, window_list)
for x in results:
   api.submit_order(x, 100, 'buy', 'market', 'day')
Finding the right params for your pattern to play out may take experimentation. See the results() function in the notebook to confirm whether your patterns have a positive edge or not.
Technology and services are offered by AlpacaDB, Inc. Brokerage services are provided by Alpaca Securities LLC (alpaca.markets), member FINRA/SIPC. Alpaca Securities LLC is a wholly-owned subsidiary of AlpacaDB, Inc.
You can find us @AlpacaHQ, if you use twitter.