In this article, I will show how you can make “roll-your-own” visualizations, using the Alpaca API with Python.
See the final code on GitHub here.

Visualizing your portfolio correlation by heatmap in Python (jupyter notebook)
Step 1: Setup
For this tutorial, I used Python 3 in jupyter notebook, some basic libraries, and the Alpaca trade API. Of course, you’ll need an Alpaca account for the API key as well!
- Get Python 3 + jupyter notebook. If you’re not setup with this already, just download Anaconda (it will install everything you need in one go).
- Sign up for an Alpaca account. Make note of the API key you get when you sign up.
- Install the Alpaca trade API for Python.
Once you have a fresh notebook started, here are the imports you’ll need:
import pandas as pd
import matplotlib.pyplot as plt
import seaborn as sns
import alpaca_trade_api  as tradeapi
# Makes output higher resolution.
%config InlineBackend.figure_format = ‘retina’
To sign into your Alpaca account, initialize REST with the API key you got at signup:
# Paper trade log-in
api = tradeapi.REST(‘YOUR_API_KEY_HERE’,
                     ‘YOUR_SECRET_CODE_HERE’,
                      ‘https://paper-api.alpaca.markets')
*Note the endpoint (‘https://paper-api.alpaca.markets') will be different for live trading.
Step 2: Get account positions.
If you’ve already started paper trading and have positions on, you can call these with:
api.list_positions()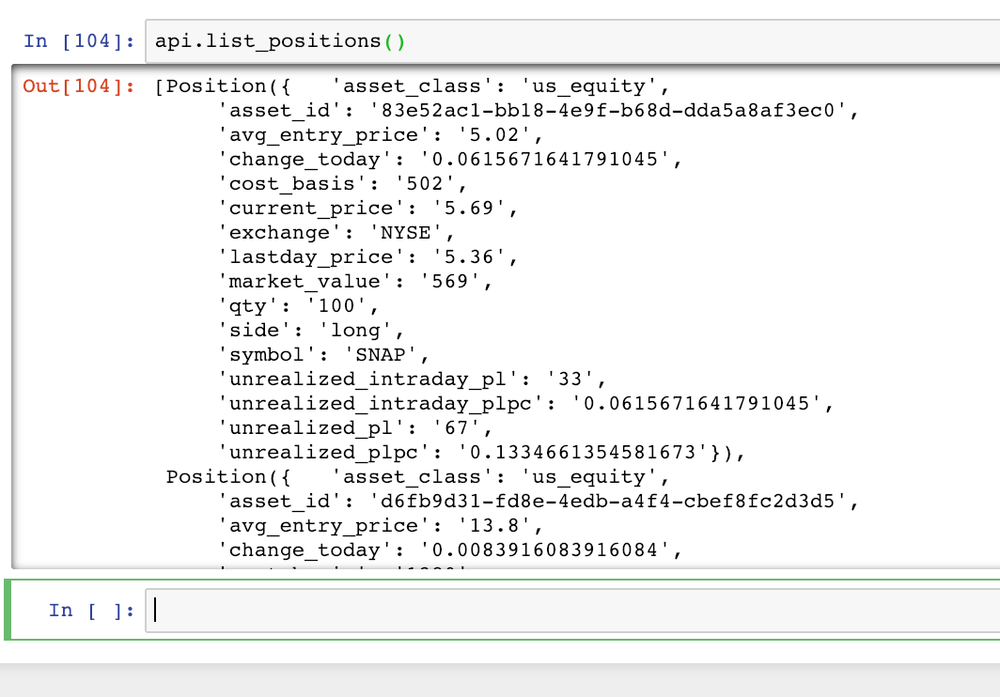
If you’re working with a fresh account, submit some fresh orders like so:
api.submit_order(‘SNAP’, 100, ‘buy’, ‘market’, ‘day’)
api.submit_order(‘SLV’, 100, ‘buy’, ‘market’, ‘day’)
api.submit_order(‘JNJ’, 100, ‘buy’, ‘market’, ‘day’)
api.submit_order(‘AAPL’, 10, ‘buy’, ‘market’, ‘day’)
api.submit_order(‘GLD’, 100, ‘buy’, ‘market’, ‘day’)
api.submit_order(‘GOOG’, 1, ‘buy’, ‘market’, ‘day’)
api.submit_order(‘CAT’, 100, ‘buy’, ‘market’, ‘day’)
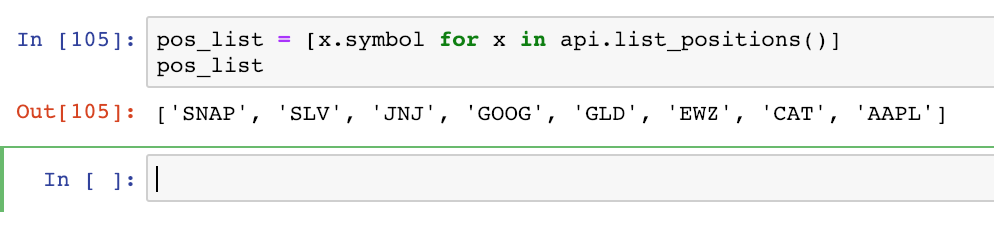
api.submit_order(‘EWZ’, 10, ‘buy’, ‘market’, ‘day’)To request our data, we just need a list of the symbol of each security:
pos_list = [x.symbol submit_order for x in api. list_positions()]
Step 3: Get data.
Alpaca has several methods of requesting data. Learn more here.
The short version is, if you sign up with a paper trading account, you may only access data from the IEX exchange.
If you have a live account, you may access IEX and full-volume data from Polygon. Polygon includes quotes, bars, fundamentals, and volume data (both historical and real-time) from all exchanges. This is extremely valuable!
This distinction is only important if you’re doing more demanding trading strategies. For our purposes, we only need the daily close of each security.
We’ll do this by requesting a “barset” object for each symbol:
def  get_bars(symbol):
     data = api. get_barset(symbol, ‘day’, limit=1000)
     data =  data.df[symbol][‘close’]
     return data
We’ll call this later, within our next step.
Step 4: Get correlations.
Here’s our code for getting all the correlations within our portfolio:
def correlation(equity_list):
df = pd. DataFrame()
equity_columns = []
# Get symbol history
for symbol in equity_list:
try:
symbol_df = get_bars(symbol)
df = pd.concat([df, symbol_df], axis=1)
equity_columns.append(symbol)
except:
print('Exception with {}'.format(symbol))
df.columns = equity_columns
# Get correlation and sort by sum
sum_corr = df.corr().sum().sort_values(ascending=True).index.values
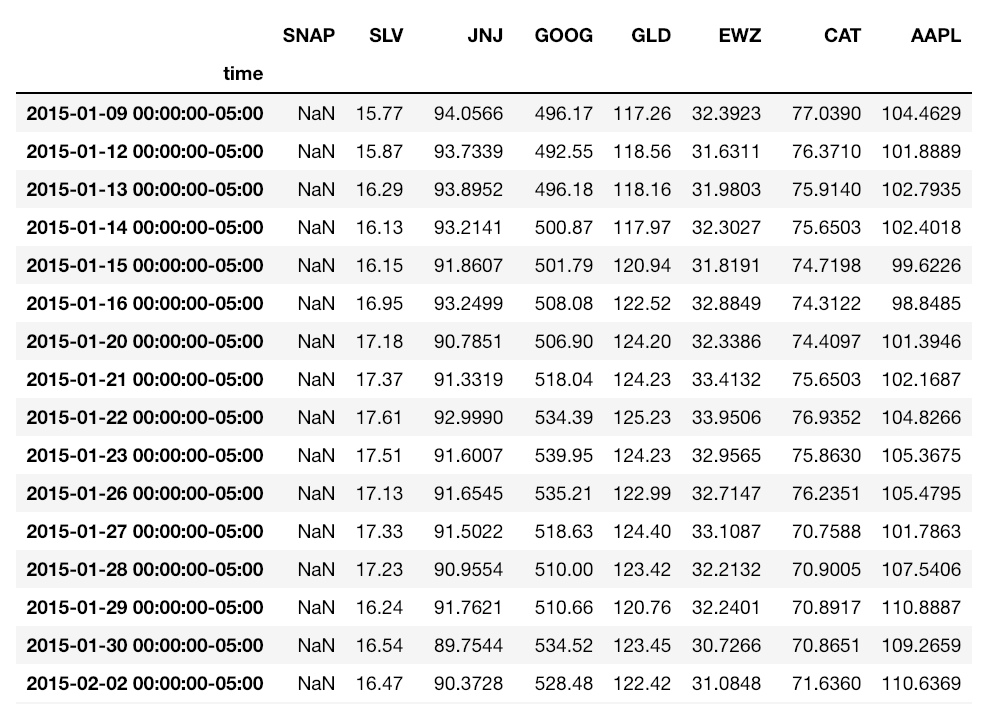
return df[sum_corr].corr()For each equity in our portfolio, we call get_bars(), then concatenate the results to our dataframe.
The results of this step alone would return a df like this:
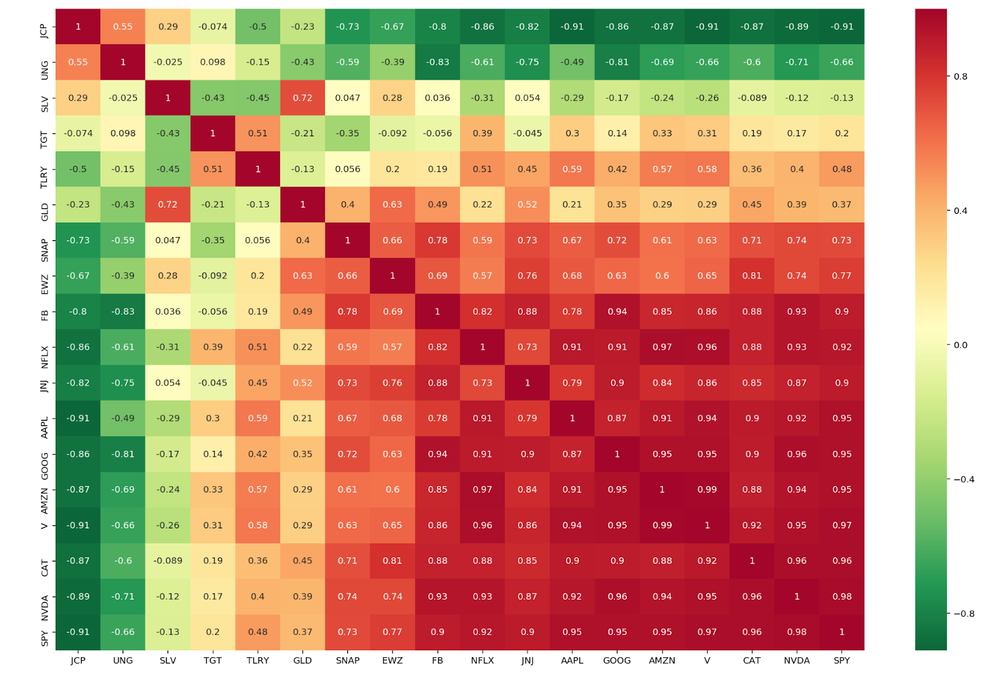
Calling .corr() returns a dataframe with the correlation coefficient (Pearson’s correlation, by default) of each symbol. It looks like this:
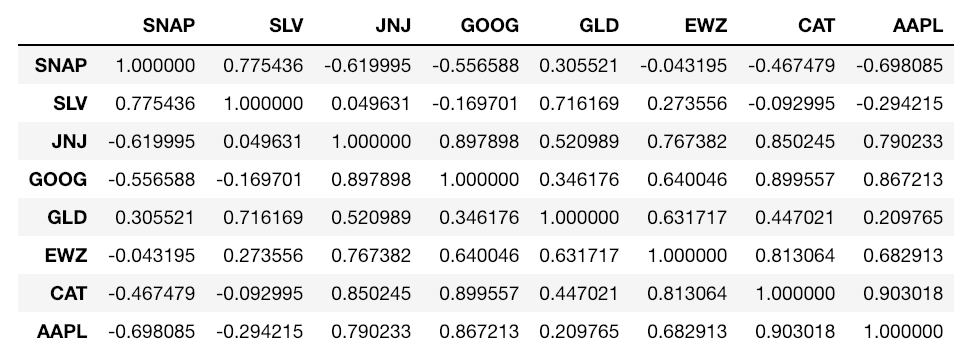
Note if you’re not familiar with correlations: Correlation coefficients range from (-1, 1). A positive value means two things move together, and a negative value that they move opposite. A value close to zero is “weak”, meaning there is no correlation, and a value close to -1 or +1 is “strong”.
For better visual organization, sort symbols by total correlation* by summing the correlation df and sorting:
sum_corr = df.corr().sum().sort_values(ascending=True).index.values
This returns a list of symbols, from least to most correlated.
Calling df.corr() again with this list sorts it by summed correlation:
return df[sum_corr].corr()
Step 5: Plot heatmap.
Finally, the easiest step:
plt.figure(figsize=(13, 8))
sns.heatmap(correlation(pos_list), annot=True, cmap=”Greens”);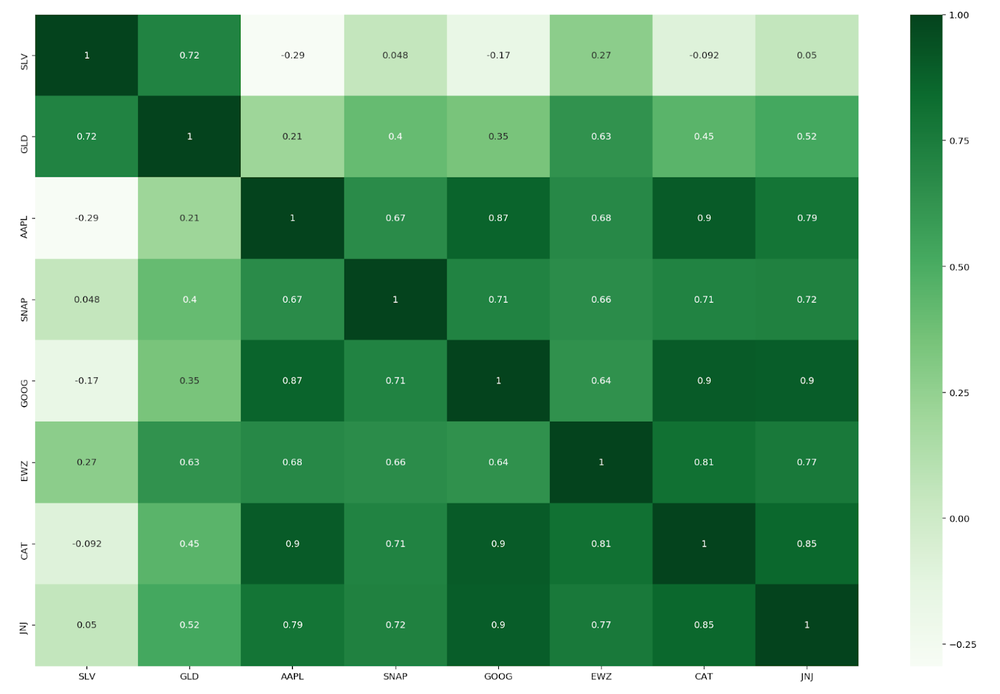
plt.figure() sets our figure size nice and big.
sns.heatmap() plots colors along a linear colormap. Calling annot adds numerical values, cmap defines your color scheme.
(I’m a fan of “RdYlGn_r”, “summer_r”, “Blues”, and “Greens”.)
Further Steps and Ideas
Thanks for reading! See the final code here.
- For each position, return the top three least correlated S&P100 stocks.
- Hedge 5% of each position with least correlated stocks.
- Find rolling correlation over time (divergence strategies!)
- Scale heatmap to position size and volatility.
Notes
*On sorting overall correlation by summing correlations:
Isn’t this disregarding data (due to +/- coefficients canceling each other out)?
In a way, yes. An alternative approach is summing the absolute values of the correlation coefficients:
# Get correlation and sort by sum
sum_corr = abs(df.corr()).sum().sort_values(ascending=True).index.valuesdf[sum_corr].corr()
However, this method is also disregarding data — the direction of the correlation coefficient.
Here is a comparison of results using both methods (with a larger portfolio):
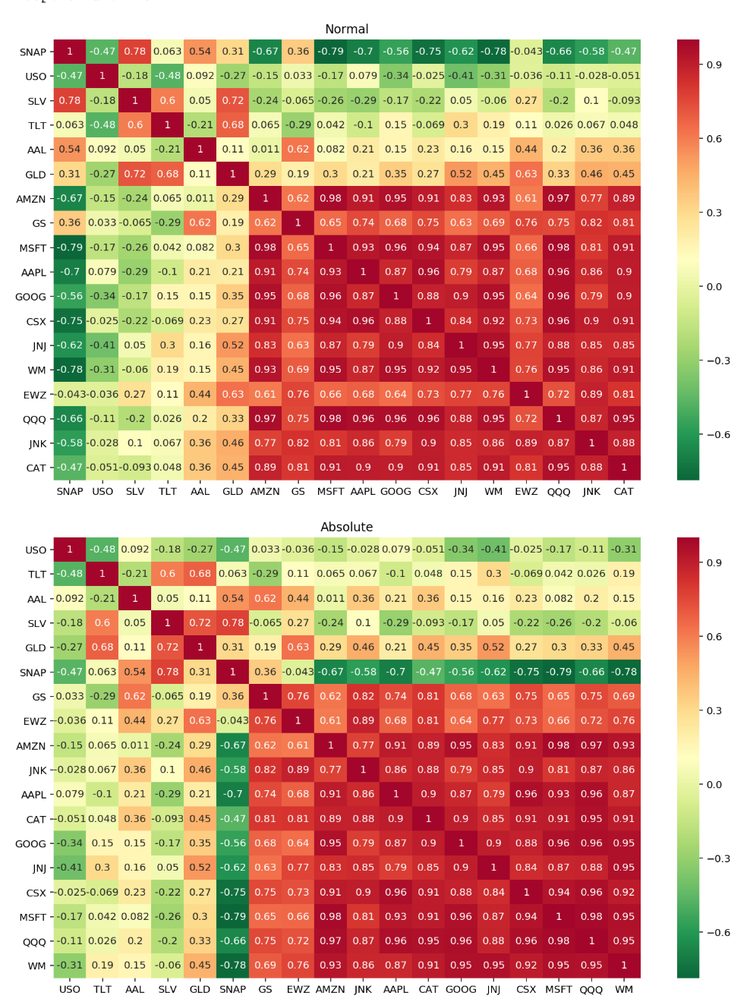
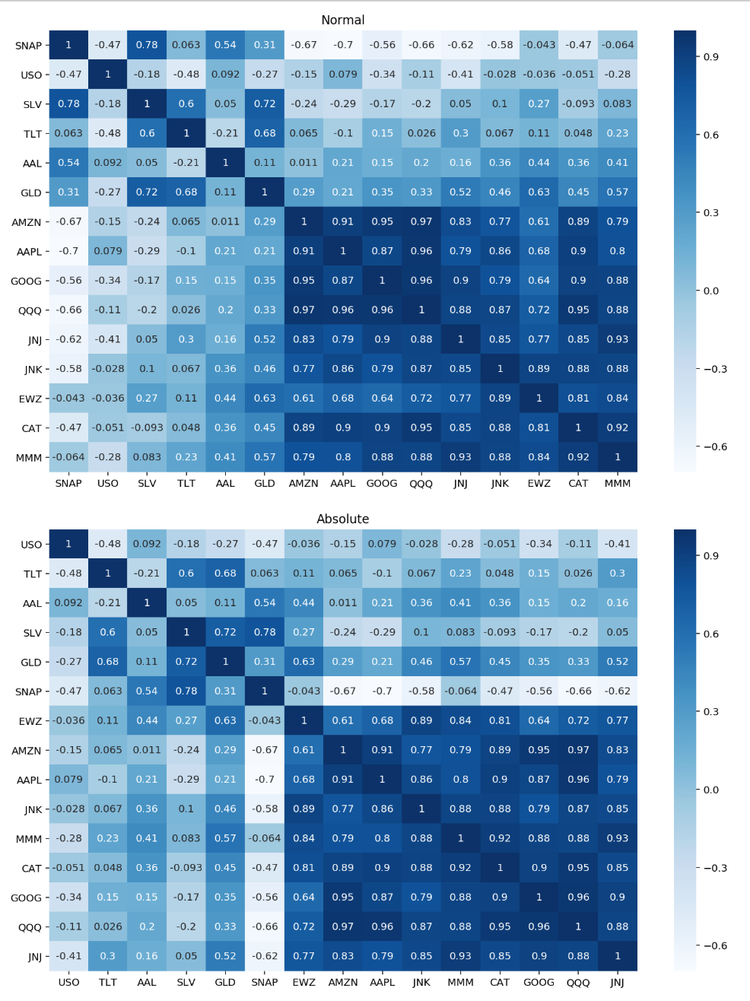
As you can see, using the absolute method is visually smoother. For example, sorting normally (negative coefs cancelling positive), some assets such as EWZ or GS get moved further down the list, even though they have greater strengths of coefficients.
As another example, using the normal method SNAP gets sorted all the way to the left. It is the top least correlated. However, using the absolute method its strength of correlation is actually in the middle.
Overall the method you use should depend on which metric you care more about: strength of correlation, strength and direction, or having a visually smooth heatmap.
Resources
Alpaca Documentation — Web API
Alpaca Documentation — Getting Started Sample Algorithm
Alpaca Trade API Documentation
Why did I use Alpaca API?
As a trader, I’m really stoked about Alpaca.
At the time of this writing, no other platform offers live trading, backtesting, accurate market data, or commission-free trading — all in one place.
Unlike other trading platforms out there, Alpaca not only offers an API for backtesting and live trading, but also brokerage services through Alpaca Securities LLC, meaning they can fill your trades (for free!) in the same ecosystem.
The catch? You must be (at least barely) code-literate. Beside the online dashboard, Alpaca has no GUI features.
The benefits, however, are endless. Essentially Alpaca’s API is a tool for building whatever you want- backtesting, live trading, paper trading, or even entering trades from the command line or Google Sheets(!).
Technology and services are offered by AlpacaDB, Inc. Brokerage services are provided by Alpaca Securities LLC (alpaca.markets), member FINRA/SIPC. Alpaca Securities LLC is a wholly-owned subsidiary of AlpacaDB, Inc.
You can find us @AlpacaHQ, if you use twitter.