Please note that this article is for educational and informational purposes only. All screenshots are for illustrative purposes only. The views and opinions expressed are those of the author and do not reflect or represent the views and opinions of Alpaca. Alpaca does not recommend any specific securities or investment strategies.

How to ensure your trading platform meets your performance needs
Some strategies, specifically day-trading strategies, require low-latency data and fast execution times.
This article will explain LiuAlgoTrader's software architecture. It will explain how to monitor the framework, strategy performance and provide tools for strategy developers to tune the code.
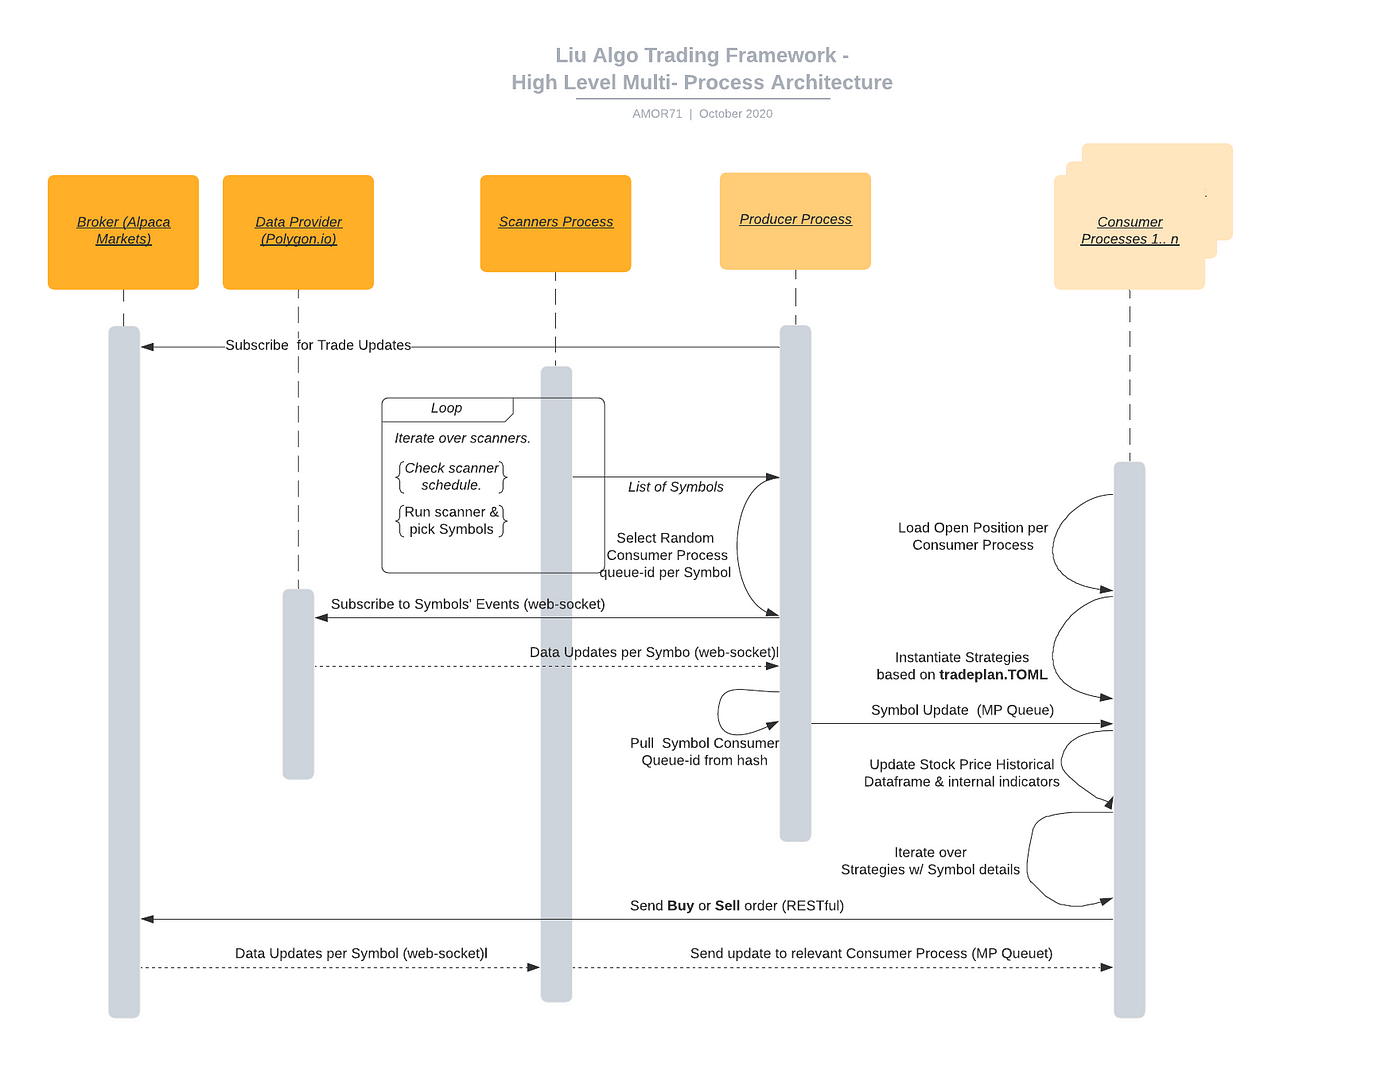
LiuAlgoTrader heavily relies on Python Multiprocessing and Python asyncio. The framework has three types of processes: Producer, Consumer, and Scanners (e.g. consumer.py , producer.py and scanners_runner.py) .
The trader application spawns a single Scanners and Producer child-processes and several Consumer child-processes. The trader process would wait for the main processes to terminate before running “end of day” calculations (more on that, in a later post ) and quitting.
The processes communicate using Queues. Queues are the primary Intern-Process-Communication means by which data moves in the framework. Queues implementation vary from one OS to another; Linux system, implement Queues using pipes.
The Scanners process shares a Queue with the Producer process. Respectively, the Producer process shares a Queue with each of the Consumer Processes.
The Scanners process runs a task to periodically call the scanners defined in the tradeplan—toml file. The task sends the newly scanned symbols over the shared Queue to the Producer process.
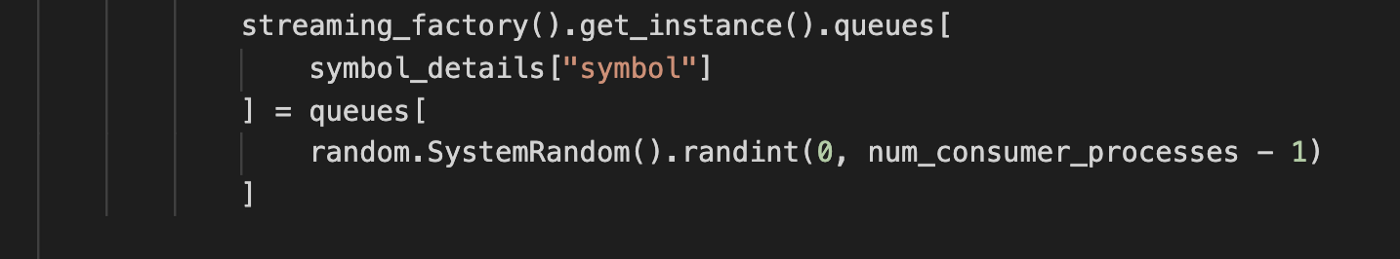
The Producer process listens to the Scanner’s process Queue. Once new symbols are coming down the pipe, the task would subscribe for updates over a web socket:

streaming_factory is a Singleton holding the specific implementation of the streaming data provider interface. The data provider is selected using the DATA_CONNECTOR environment variable. Currently, supported values are “alpaca” for Alpaca Markets and “polygon” for Polygon.io.
The Consumer(s) are doing the ‘heavy lifting’: receiving stock price & trade updates and executing strategies per symbol per second. Symbol updates may be in the thousands per minute.
The platform spawns several consumer processes and load-balance symbols between the available consumers to optimize performance—the optimal number of consumers varieties between hardware & software setup and the specifics of the strategies.
If the environment variable NUM_CONSUMERS is present, it will dictate the number of consumer processes. If the value is 0 or non-present, the platform will determine the optimal number of consumer processes by applying heuristics on the current system load average and the number of available processors.
The platform keeps a mapping between symbols and Consumer processes. The mapping ensures that certain symbol updates are consistently sent to the same queue.
Separating execution between Consumers processes increases the platform throughput by maximizes the usage of available computation resources. A side effect is also reducing risks: if a strategy throws an exception or a Consumer process terminates abnormally, the rest of the Consumers will continue to work unhindered.
The QueueMapper class holds the mapping between symbols and Queues . “load balancing” between the different Consumers is achieved by the Producer process when receiving new symbols from the Scanners process:
The current implementation would evenly spread symbols between the different consumer processes. In the future, the platform may implement additional, more advanced load-balancing logic.
The framework executes strategies on per-second boundaries. Strategy execution time is crucial to the proper tuning of the trading platform — even the most tuned framework will tip if the strategy computation time takes long to execute.
The first step in tuning the trading platform is to establish a performance baseline. A baseline means finding the range of concurrent symbols the framework can track within acceptable performance parameters.
The framework KPIs are:
- Data latency (DL): the elapsed time between the market participant timestamp on an event and the current time measured.
- Number of Events Produced per second (PE): This measure is the number of updates received over the WebSocket and sent to the Consumer Queues. The more symbols produced by the Scanners process, the higher the number would be. PE would go up as the market becomes more active during the beginning and end of the trading day.
- Number of Events Consumed per second (CE): This measure indicates the number of events processed by the Consumer process. Consuming events keeps track of aggregated per minute data and executing strategies per second (or any other time frame). Aggregated data include OHLC (=Open High Low Close) data, plus per-minute volume, number of trades, and VWAP.
- Average time spent in Queue (TQ): The average time between the Producer posting new data into the Consumer Queue and the Consumer worker pulling the data. An increase in the measure means the Consumer is too busy executing strategies increasing Data Latency.
Market participants have up to 10 seconds to report trades during market hours (and there is no such requirement during extended trading hours), leading to an acceptable average DL of 2 seconds.
- When the DL exceeds the upper bound of 10 seconds, the framework would start logging errors and not execute trades on the second mark to reduce load and rebalance the system. Such spikes are “okay” on high-load periods (such as running heavy scanners). Still, if the framework passes a tipping point where it can’t rebalance back to average data latency, and data latency keeps going up, it will practically be the end of the trading day.
- An increase in TQ may be an earlier indication of an increase in DL. It may also mean OS & infrastructure issues.
- High variance in CE between different consumers may indicate an imbalance between the other Consumers.
The platform uses OpenTelemetry / OpenCensus to send metrics and tracing information to Google Cloud Platform and use Google Monitoring and Google Tracing to view the results. However, the platform can be easily adjusted to send metrics and tracing information to any other destination supported by OpenCensus / OpenTelemetry.
The platform uses MNQueues wrapper around Python Queues, allowing PE/CE and TQ metrics to be sent to Google Monitor.
There are two different aspects for the platform performance KPI analysis: Monitoring KPIs and Tracing specific flows & calls. The same tools available here are also available for the strategy developer to understand and tune the performance.
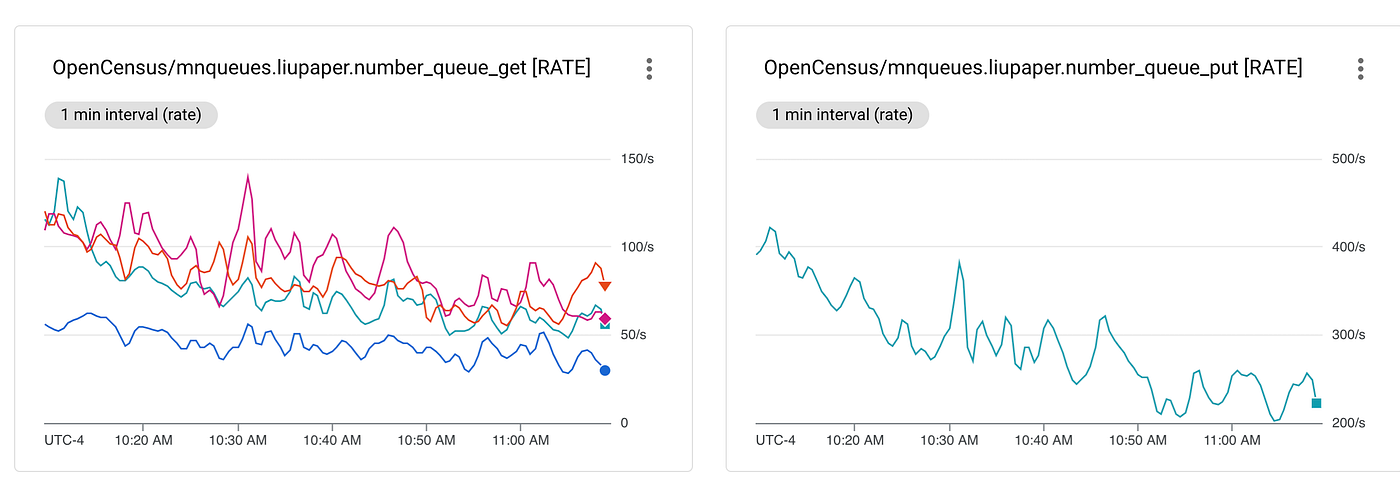
The above figure uses a scanner to pump updates on 600 symbols. The Right figures show the PE: the number of events per second sent from the Producer process to all Consumer processes. Around 10 AM EST, as the market eases off, the open period updates go down from 400 per second to around 200 per second shortly after 11 AM EST.
The right figure shows the distribution of CE between the 4 Consumer processes. When viewing the figure and knowing that symbols are evenly (and randomly) distributed between the 4 processes, we can deduce a high variance in activity between the different scanned stocks.
The next figure shows the DL and TQ distribution which are visualized as bucketed heat-maps. The left side shows the data latency between the time-stamp generated by the market participant and the time-stamp post internal processing. In other words, the update passed all the way from the market participant to the data provider (i.e., Alpaca Markets ) via the web-sockets to the Producer and from there to the Consumer process. The consumer then processed the message and updated the internal per-minute aggregate for the symbol. For the 600 concurrent symbols, the 50 percentile was below 75 ms (!), only 1 percentile reached the maximal allowed 10 seconds update time, while over 95% are well under a second. Not bad for a freemium trading platform ?.
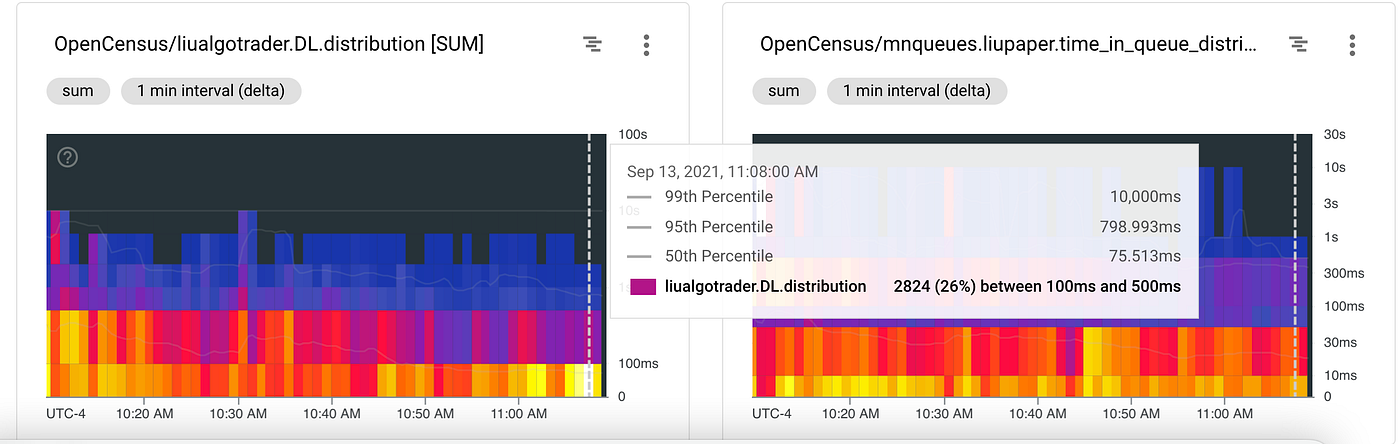
The TQ heatmap helps us understand DL further: the 50% percentile of messages spend below 30ms waiting in the queues, while 95% spend below 300ms and only 1% spend around one second. Subtracting TQ distribution gives us a good picture of the contribution of the platform processing to the DL vs. delays downstream in the connectivity between the market participant and the data provider.
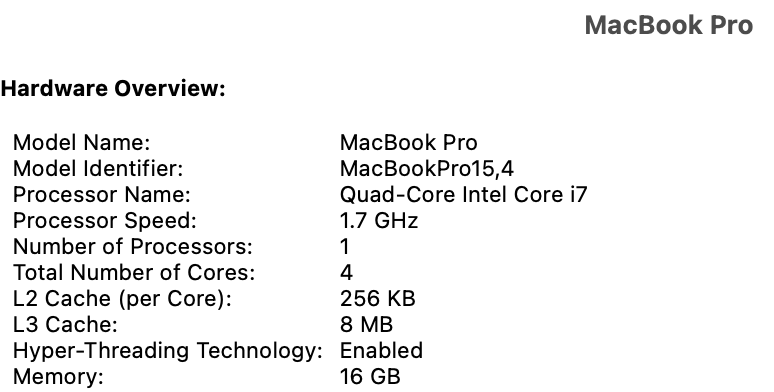
As a baseline for the platform performance, this specific sample was running on my personal Laptop. During this analysis, a single strategy was used, which returns immediately, thus helping establish a baseline for performance. A Verizon consumer-grade fiber network in NYC Financial District connected the laptop to the Internet.
To reproduce the same results for PE, CE, and TQ, include the below line
gcp_monitor_measure_prefix = “gcp-prefix”
in the tradeplan.toml. The parameter would trigger the MNQueue package to send Queue metrics to GCP and include the prefix in the measure name, making it easier to define a dashboard.
The DL measure (liualgotrader.DL) is sent to GCP Monitoring if the below environment variable is defined before running the trader application:
export LIU_TRACE_ENABLED=1
Our tuning does not end here. In a way, it only begins: a strategy developer needs tools to analyze how long function calls & calculations take, how calls are executed. OpenTelemetry was designed specifically for that use case.
The below example shows tracing for the main Consumer flows. The first figure presents Google Trace List, showing spans (in OpenTelemetry terminology) sharing the same trade-id.

The next figure shows a specific trace, with handle_data_queue_msg() as the “root span,” followed by “child spans,” including their length and execution order (keep in mind calls are done using asyncio).
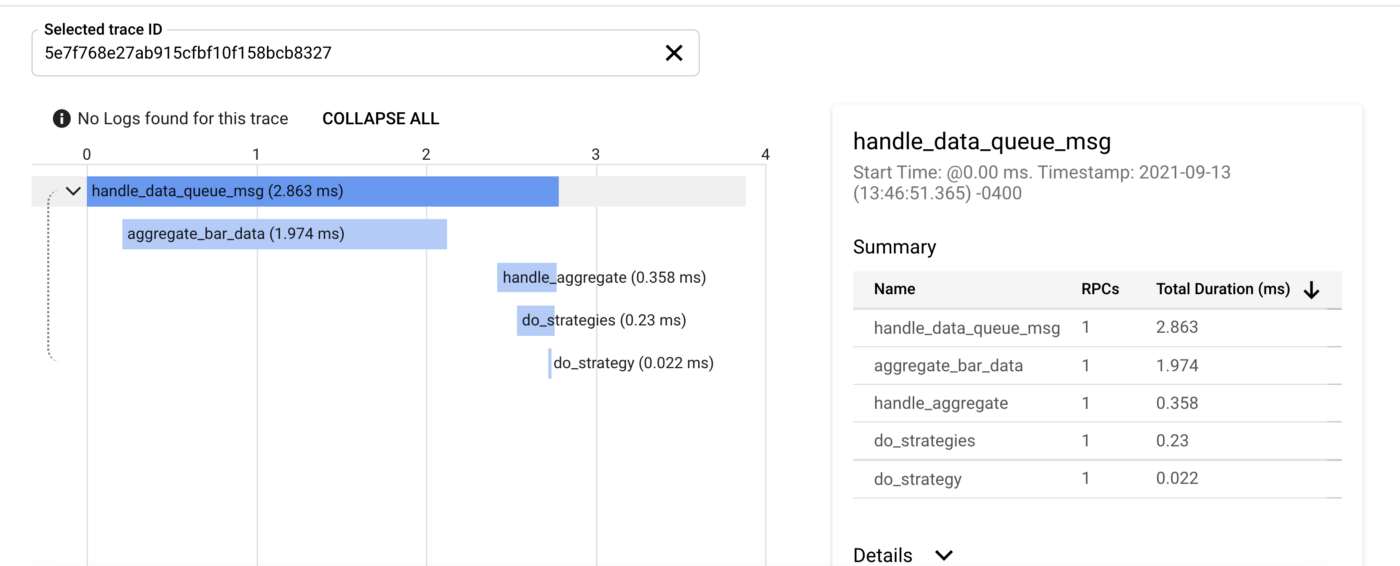
The platform provides few tools for tracing functions:
- The tracer module: use get_tracer() to initialize tracing.
- Tracing decorator: the decorator assumes that the calling function receives a required keyword parameter
carrier. The carrier parameter passes trace-context, allows child-spans, and produce a full trace view of the calls. - Tracing works cross-process, threads, tasks, and asyncio calls.
- To use the trace decorator, either uses it as a plain decorator or call it explicitly as in:await trace({})(handle_data_queue_msg)(data, trader, data_loader)
For setting up a root-span, or,
await trace(carrier)(handle_aggregate)(
trader=trader,
data_loader=data_loader,
symbol=symbol,
ts=time_tick[symbol],
data=data,
carrier=None,
)
for a child-span.
Once the LIU_TRACE_ENABLED environment variable enables the tracing function, the DL metric is sent to Google Monitoring and basic tracing details for the Consumer message.
If enabled, make sure there is a sufficient quote configured in Google Trace. Otherwise, HTTP error 429 will be thrown by the OpenTelemetry SDK.
Thank you for reading this article. I hope you found it informative. If you have any questions or found any issues, please feel free to post a question or comment on the LiuAlgoTrader Gitter page or open an issue on GitHub or email me directly.
In the next article, I will present how to set up and configure a production-grade setup for LiuAlgoTrader.
Alpaca does not prepare, edit, or endorse Third Party Content. Alpaca does not guarantee the accuracy, timeliness, completeness or usefulness of Third Party Content, and is not responsible or liable for any content, advertising, products, or other materials on or available from third party sites.
Brokerage services are provided by Alpaca Securities LLC ("Alpaca"), member FINRA/SIPC, a wholly-owned subsidiary of AlpacaDB, Inc. Technology and services are offered by AlpacaDB, Inc.
Interested in getting the latest news and content from Alpaca? Follow us on LinkedIn, Twitter, and Facebook for more.