ETF is one of the great investment products in the last decade, and it has allowed so many people to gain the exposure to the wide range of assets easily at low cost. It is easy to buy a share of ETF without knowing what’s in there, but as a tech-savvy guy yourself, you may wonder how it works. By reconstructing the fund yourself, you may even come up with something better.
In this article, we present some basis for you to start your research easily in python to science the ETF world. You can find the complete notebook in GitHub.

What is ETF by the way?
ETF stands for Exchange-Traded Fund. Unlike other types of funds, its shares are traded in exchanges like individual company’s common stocks. The fund is managed by an ETF company and manages portfolio based on the strategy, often diversifying the exposure spread across the market.
One of the most popular ETF is SPY, that tracks S&P 500 index performance. Because of its convenience to manage the risks, not only has it been used by individual investors, but also robo advisors construct their portfolio using ETFs. The convenience doesn’t come for free, of course, and there is an associated cost called expense ratio, that varies an ETF to another.
An ETF’s return comes from the returns of underlying assets it holds. ETFs can hold not just individual stocks but also options and swaps, but in the case of market index ETF like SPY, it constructs a simple long position portfolio.
If the constituents are simply long only stocks, is it easy to run some simulation even in python? If it’s possible to build your own ETF-like portfolio, you don’t even need to pay ETF cost? The answer is YES.
Recreating ETF
Various services provide ETF constituent data either through their website or API, with paid and unpaid style. Some provide even historical data. We recommend to find your best services by yourself, but here we automate the process by Selenium to save your time copying and pasting the list of underlying stocks of particular ETF.
import pandas as pd
'''
brew install phantomjs
or
brew tap homebrew/cask
brew cask install chromedriver
'''
# from selenium import webdriver
from selenium.webdriver.chrome.webdriver import WebDriver

def get_etf_holdings(etf_symbol):
    '''
    etf_symbol: str

    return: pd.DataFrame
    '''
    url = 'https://www.barchart.com/stocks/quotes/{}/constituents?page=all'.format(
        etf_symbol)

    # Loads the ETF constituents page and reads the holdings table
    browser = WebDriver() # webdriver.PhantomJS()
    browser.get(url)
    html = browser.page_source
    soup = BeautifulSoup(html, 'html')
    table = get_table(soup)

    # Reads the holdings table line by line and appends each asset to a
    # dictionary along with the holdings percentage
    asset_dict = {}
    for row in table.select('tr')[1:-1]:
        try:
            cells = row.select('td')
            # print(row)
            symbol = cells[0].get_text().strip()
            # print(symbol)
            name = cells[1].text.strip()
            celltext = cells[2].get_text().strip()
            percent = float(celltext.rstrip('%'))
            shares = int(cells[3].text.strip().replace(',', ''))
            if symbol != "" and percent != 0.0:
                asset_dict[symbol] = {
                    'name': name,
                    'percent': percent,
                    'shares': shares,
                }
        except BaseException as ex:
            print(ex)
    browser.quit()
    return pd.DataFrame(asset_dict)
get_etf_holdings() will return the list of constituents in pandas DataFrame format, and the columns include weight in the portfolio and an actual number of shares holding as of today.
Note this does not come with the price data, but you can pull the historical price data from IEX API for free.
import iexfinance
import pandas as pd

def iex_charts(symbols):
    partlen = 99
    result = {}
    for i in range(0, len(symbols), partlen):
        charts = iexfinance.Stock(symbols[i:i+partlen]).get_chart(range='1m')
        if type(charts) == list:
            charts = {symbols[i]: charts}
        for symbol, data in charts.items():
            df = pd.DataFrame(data)
            df.date = pd.to_datetime(df.date)
            df.set_index('date', inplace=True)
            df.index.names = ['epoch']
            df.index = df.index.tz_localize('America/New_York')
            result[symbol] = df
    return result

def get_closes(constituents):
    symbols = list(constituents.columns)
    charts = iex_charts(symbols)
    return pd.DataFrame({symbol: df.close for symbol, df in charts.items()})
get_closes() will take the constituent data from get_etf_holdings() and return the daily closing price history for the last month from IEX API.
Simulate SPY performance
Before doing something unique, let’s just check if our assumption is correct. The task here is to calculate the historical performance of reconstructed portfolio and compare that with the actual ETF.
Remember the constituent list we have is the one as of today. The fund may have rebalanced, but we assume that’s not the case and we build our portfolio a month ago. Putting altogether, we get something like this.
| epoch | replicated | original | |
|---|---|---|---|
| 2018-07-23 00:00:00-04:00 | 0.0 | 0.0 | |
| 2018-07-24 00:00:00-04:00 | 0.004842152599199184 | 0.005032119914346984 | |
| 2018-07-25 00:00:00-04:00 | 0.014004961318249324 | 0.013597430406852257 | |
| 2018-07-26 00:00:00-04:00 | 0.010925193556577603 | 0.011206281227694456 | |
| 2018-07-27 00:00:00-04:00 | 0.004277340381589269 | 0.004354032833690319 | |
| 2018-07-30 00:00:00-04:00 | -0.0014288588707714984 | -0.0008922198429693077 | |
| 2018-07-31 00:00:00-04:00 | 0.0034754019979314626 | 0.004032833690221255 | |
| 2018-08-01 00:00:00-04:00 | 0.0024404618505173285 | 0.0023554603854390615 | |
| 2018-08-02 00:00:00-04:00 | 0.007497095460409252 | 0.007815845824411126 | |
| 2018-08-03 00:00:00-04:00 | 0.012310263987800708 | 0.012134189864382706 | |
| 2018-08-06 00:00:00-04:00 | 0.01600898298220732 | 0.015845824411134895 | |
| 2018-08-07 00:00:00-04:00 | 0.018886733562597572 | 0.019200571020699483 | |
| 2018-08-08 00:00:00-04:00 | 0.018653808853420828 | 0.018772305496074202 | |
| 2018-08-09 00:00:00-04:00 | 0.0174391016188712 | 0.01738044254104213 | |
| 2018-08-10 00:00:00-04:00 | 0.010493083559571296 | 0.010563882940756733 | |
| 2018-08-13 00:00:00-04:00 | 0.006464169458113584 | 0.00678087080656686 | |
| 2018-08-14 00:00:00-04:00 | 0.012985904143422437 | 0.013204853675945713 | |
| 2018-08-15 00:00:00-04:00 | 0.005466470526354932 | 0.005638829407565968 | |
| 2018-08-16 00:00:00-04:00 | 0.013730773434213854 | 0.013775874375446159 | |
| 2018-08-17 00:00:00-04:00 | 0.0171755102523129 | 0.017344753747323388 | |
| 2018-08-20 00:00:00-04:00 | 0.019684923803575862 | 0.019521770164168548 | |
| 2018-08-21 00:00:00-04:00 | 0.02182281981402551 | 0.021912919343326148 |
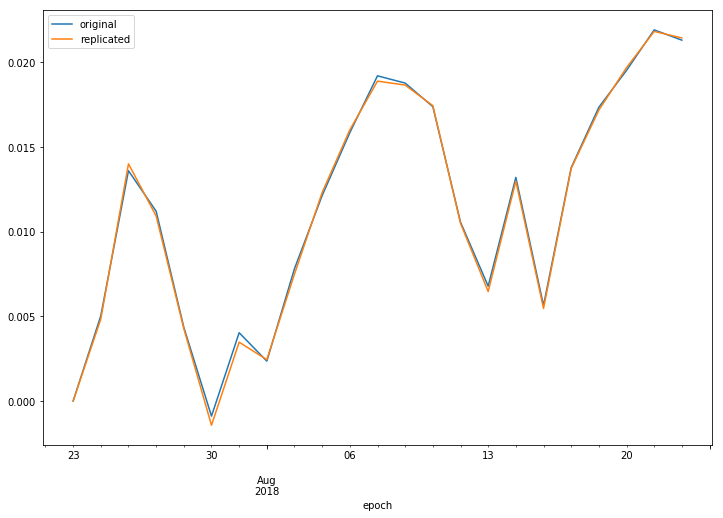
Even though we took the constituent data as of today, and applied it to simulate the last month, the result isn’t too different. This means this ETF hasn’t changed the holding shares significantly.
So, I don’t need to buy ETF but just buy these stocks?
It’s a natural question whether you can replicate ETF portfolio by buying only underlying stocks.
Yes, you can, only if you have more than $260,000,000,000 ($260BN) which is SPY’s market cap today. But no, you don’t have it, so let’s see how it changes if you do so with $10K. The resulted portfolio we get after some calculation is as below.
| shares | price | dollar | ||
|---|---|---|---|---|
| AAPL | 2.0 | 190.9403 | 381.8806 | |
| MSFT | 3.0 | 107.556 | 322.668 | |
| FB | 1.0 | 210.91 | 210.91 | |
| JPM | 1.0 | 113.35 | 113.35 | |
| JNJ | 1.0 | 126.63 | 126.63 | |
| XOM | 1.0 | 80.569 | 80.569 | |
| BAC | 3.0 | 30.75 | 92.25 | |
| WFC | 1.0 | 57.5786 | 57.5786 | |
| PFE | 2.0 | 36.8958 | 73.7916 | |
| T | 3.0 | 31.0 | 93.0 | |
| VZ | 1.0 | 50.75 | 50.75 | |
| CSCO | 1.0 | 42.06 | 42.06 | |
| INTC | 1.0 | 51.9938 | 51.9938 | |
| PG | 1.0 | 78.51 | 78.51 | |
| MRK | 1.0 | 62.69 | 62.69 | |
| C | 1.0 | 69.7702 | 69.7702 | |
| KO | 1.0 | 44.95 | 44.95 | |
| CMCSA | 1.0 | 34.17 | 34.17 | |
| ORCL | 1.0 | 48.67 | 48.67 | |
| GE | 3.0 | 12.99 | 38.97 | |
| F | 1.0 | 10.47 | 10.47 |
The actual total market value of this portfolio is about $2K. The reason why it diverges from the original target is because you don’t buy fractional shares. All fractions are truncated, resulting to much smaller. On the flip side, we found that we can build something similar to SPY with smaller amount of dollar. Running the same historical plotting, we get this.
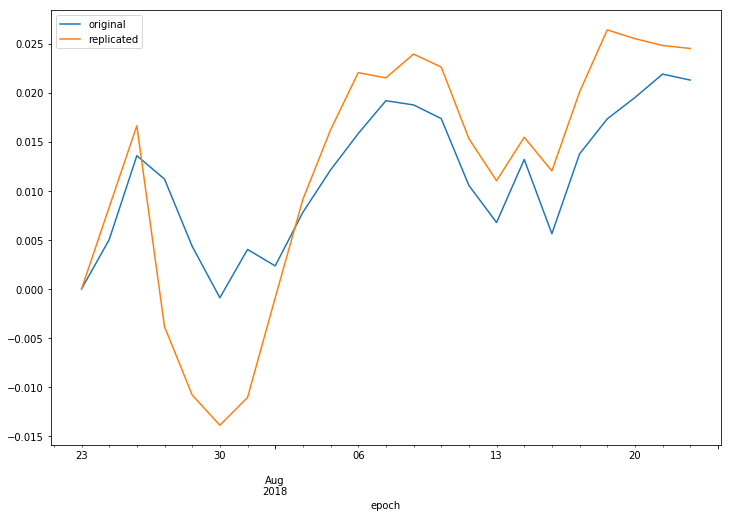
The divergence is much bigger compared to the first one, and the volatility increased, but in terms of the return, it is not too bad. As a study, it is great to see the actual example like this that more diversified portfolio has less volatility, as the modern portfolio theory teaches.
Summary, and now what?
We presented some python research with actual notebook to study how ETF works, and did some simple experiments. You can look at the complete notebook here.
You can try it in your environment! We recommend to clone the notebook and extend the study for your purpose from here. Potential questions you may ask are:
- what if the cash size is bigger, or smaller?
- how about other index ETF such as QQQ?
- how much dollar do you need to have at least one share for each?
- can you replicate the return more precisely by rebalancing frequently?
- can you build something similar by using other set of stocks too?
Research is always fun, and you should continue asking these questions. It is a great moment that this kind of research can be done in a day with only your laptop.
We leave it to the readers to what to do from here, but please let us know what you find if you do something in the comment, or to our Twitter @AlpacaHQ! We hope you will leverage the technology to automate your investments.