Please note this blog was originally published on April 4, 2024.
Have you ever wondered what is the secret sauce to creating a high-performing algorithmic trading strategy? It's analytics. Analytics is the guide for creating winning strategies, providing you with critical insights to fine-tune and optimise your trading approach. In this blog post of the series, we'll delve deep into the world of analytics in Phoenix by AlgoBulls, shedding light on how you can harness these insights to elevate your trading game.
In case you have not read our previous blogs of this series, make sure to start from “Exploring Trading Strategies with AlgoBulls' Phoenix” so you get a much clearer understanding of algorithmic trading using AlgoBulls’ Phoenix.
Before we view the Analytics, make sure you have executed a strategy. To do that simply execute a trading strategy by following the steps given in our previous blog “Validating and Configuring your Trading Strategy”.
Once execution is complete, you can see right below your coding section, there are 2 tabs: Analytics and Data. Click on Analytics Tab to view the Charts and Metrics generated to analyze the performance and returns of your strategy.
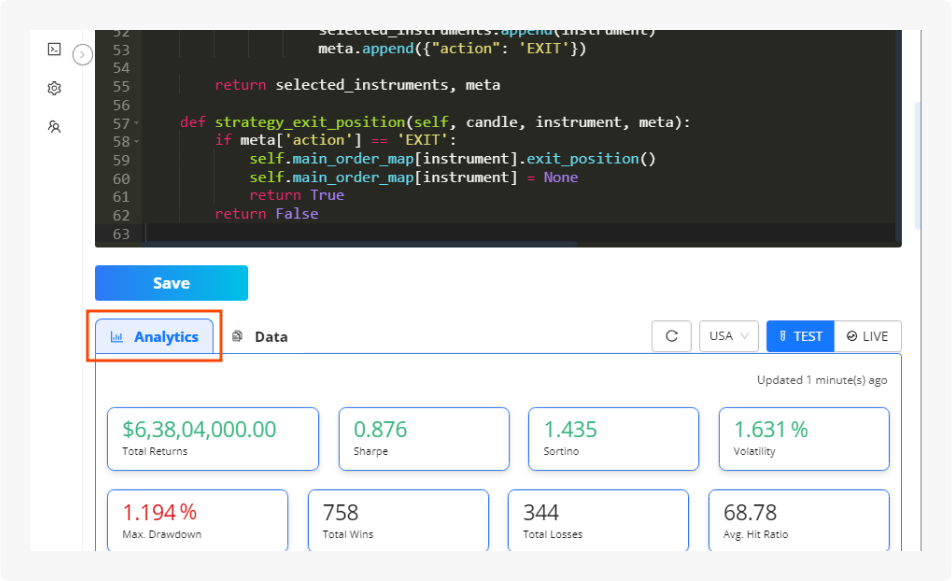
In case you have not run a Backtest for your strategy yet, you can go to any Ready Templates and check out ready analytics by scrolling down. As an example, check the Analytics of one such Ready Template.
Performance Metrics Demystified
Before we dive into the fascinating world of analytics, let's first understand the performance metrics that Phoenix offers to assess your strategy's effectiveness. These metrics are your trusted allies, helping you evaluate and improve your trading strategy.
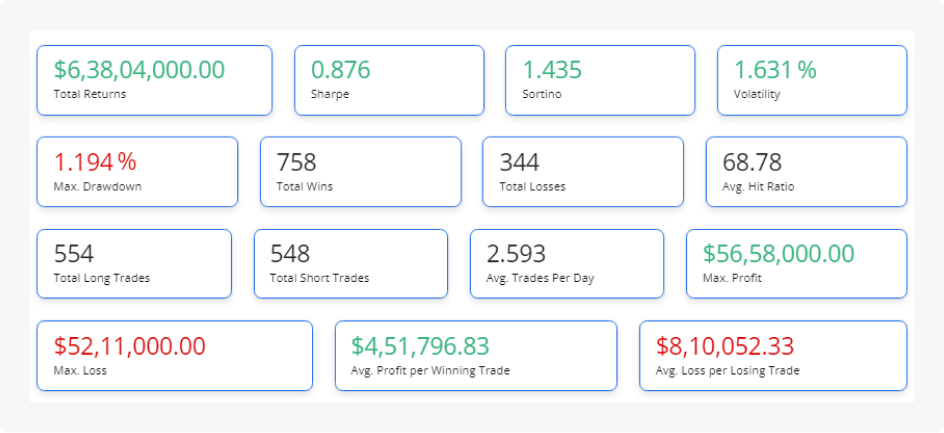
Total Returns
Total returns represent the cumulative sum of all profits and losses generated by your executed strategy, from its inception to the present day. It's the grand total of your trading journey.
Sharpe Ratio
The Sharpe ratio is a crucial metric in evaluating your strategy's performance relative to the risks it takes. It quantifies the excess return your strategy achieves per unit of risk endured. A higher Sharpe ratio indicates superior risk-adjusted performance.
Sortino Ratio
While the Sharpe ratio looks at overall risk, the Sortino ratio hones in on downside risk. It assesses your strategy's returns concerning downside volatility, focusing solely on negative price movements. A higher Sortino ratio means your strategy excels at mitigating the impact of downside risk.
Volatility
Volatility measures how much your strategy's returns fluctuate from one trade to another. High volatility implies larger fluctuations, signalling both the potential for substantial gains and losses. Low volatility, on the other hand, suggests more stable returns.
Unlocking Visual Insights
Now, let's venture into the realm of visualisations, where we can uncover trends and patterns with remarkable clarity.
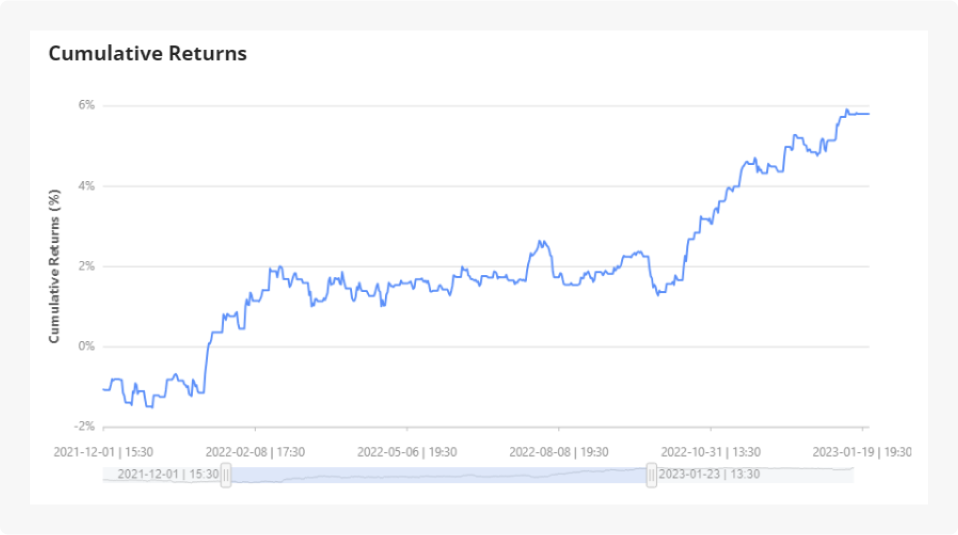
Cumulative Returns
This chart paints a picture of how your strategy's returns have evolved over time. Positive values indicate gains, while negatives represent losses. The larger the positive returns, the better. Keep in mind that this chart focuses solely on gains and losses, excluding considerations of risk and timing.
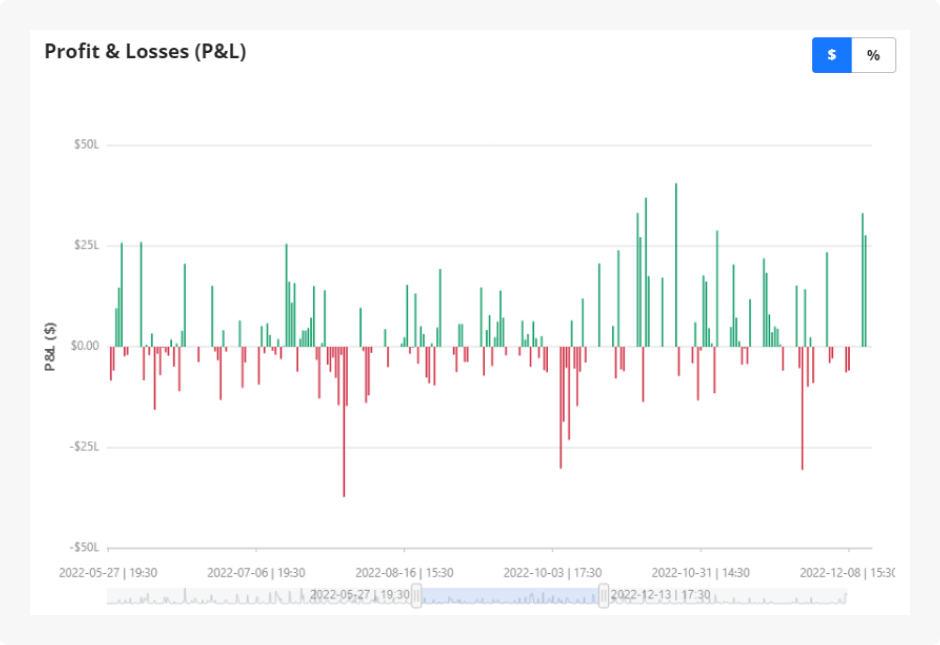
PNL Returns
This chart showcases the profit or loss per trade plotted on a timeline. You can switch between viewing values in percentages or dollars, depending on your preference.
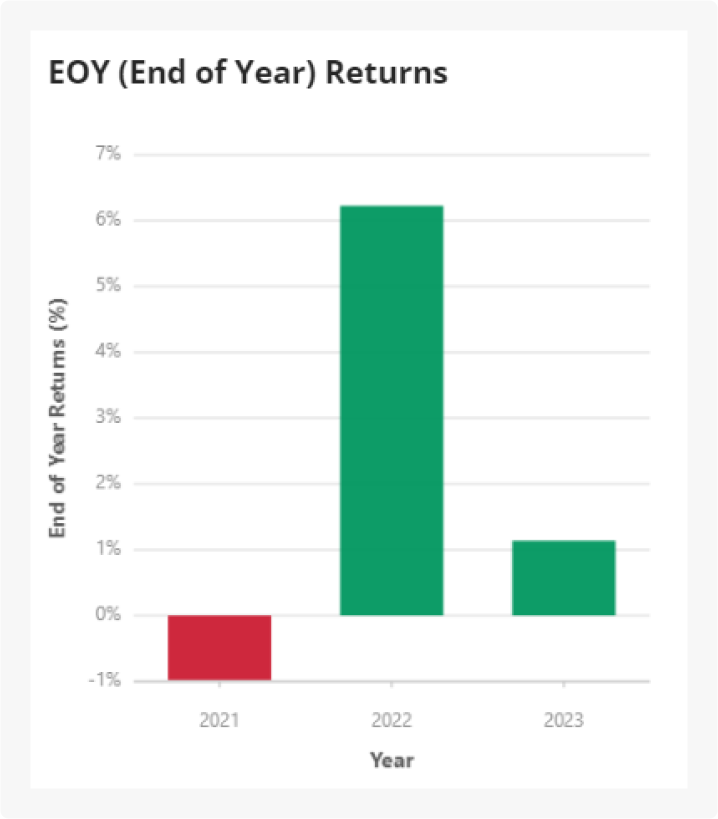
End of Year Returns
This chart offers a bird's-eye view of your strategy's annual performance as a percentage, providing an overview of its overall performance across each year.
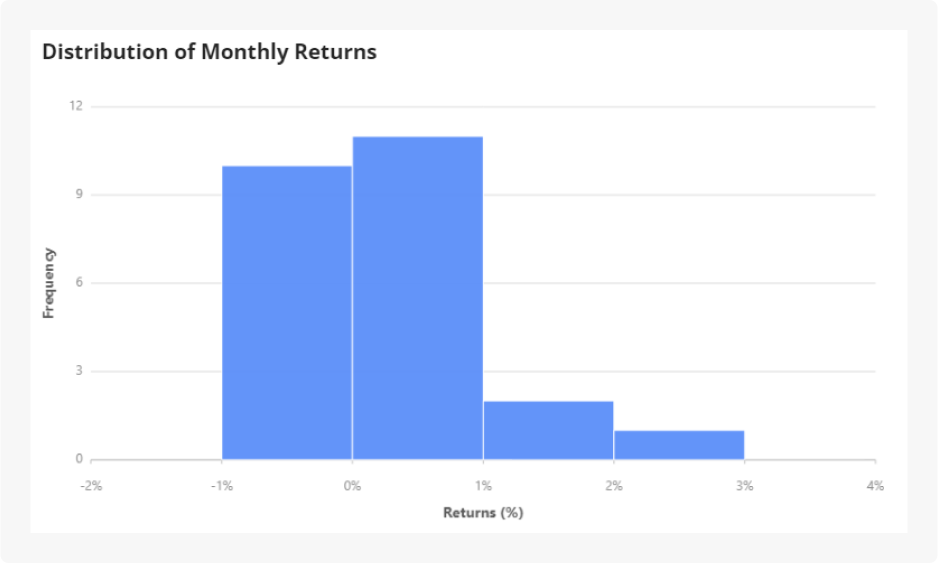
Monthly Returns Distribution Histogram
This chart reveals the frequency distribution of returns across consecutive months. This histogram helps you understand the range and patterns in monthly returns, shedding light on your strategy's volatility and performance trends.
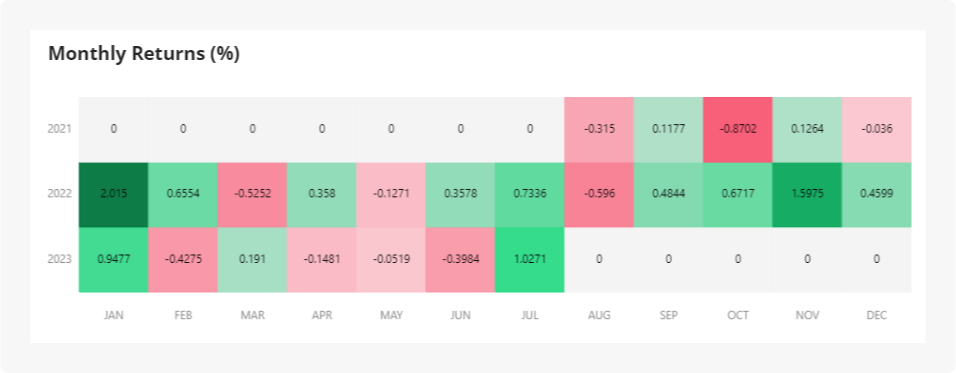
Monthly Returns Heatmap
This chart provides a colour-coded view of your strategy's performance over months. Shades of green signify positive returns, while shades of red indicate losses. This visual tool aids in identifying trends and patterns, making it easier to spot strong and weak performance periods.
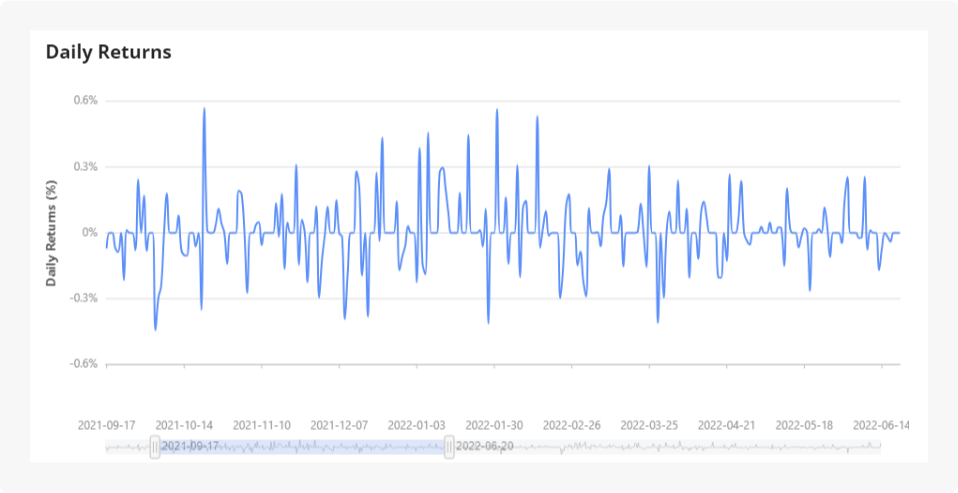
Daily Returns
This chart displays the percentage change in your strategy's returns between trading days. It offers insights into short-term volatility, trend analysis, and risk assessment.
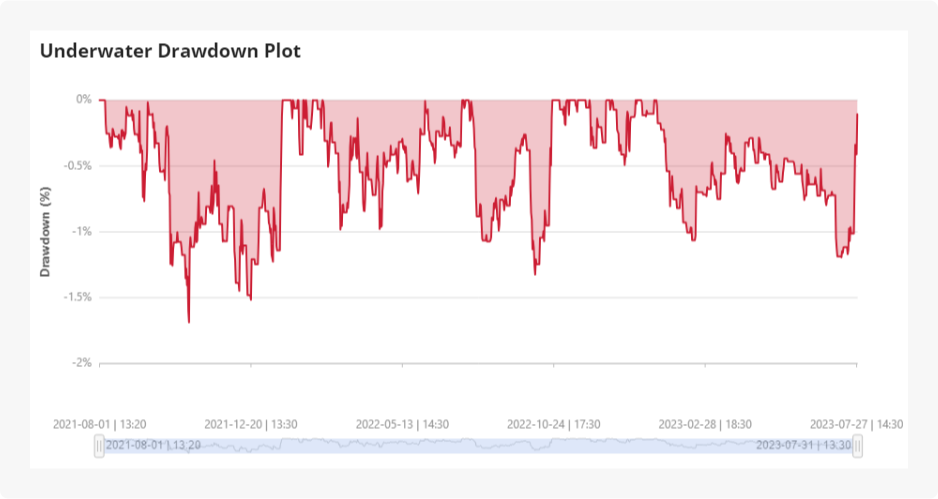
Underwater Plot
This plot visually represents your strategy's performance concerning its historical peaks. It showcases how much your returns have declined from their highest point over time, helping you understand periods of drawdown and recovery, along with historical risk and resilience.
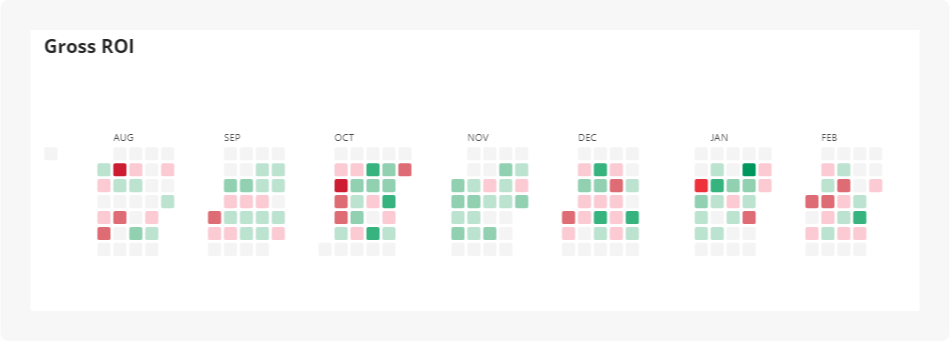
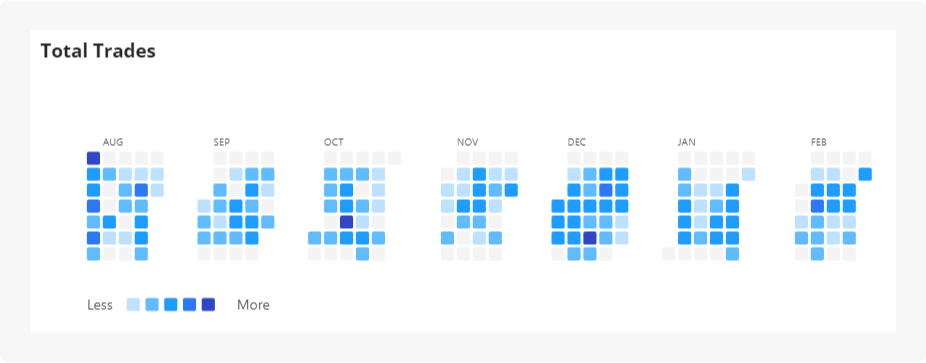
Heatmaps
We've also included three calendar Heatmaps for Gross ROI, Trading Volume, and Total Number of Trades. These heat maps use colour codes to depict daily aggregated values, offering visual insights into these metrics.

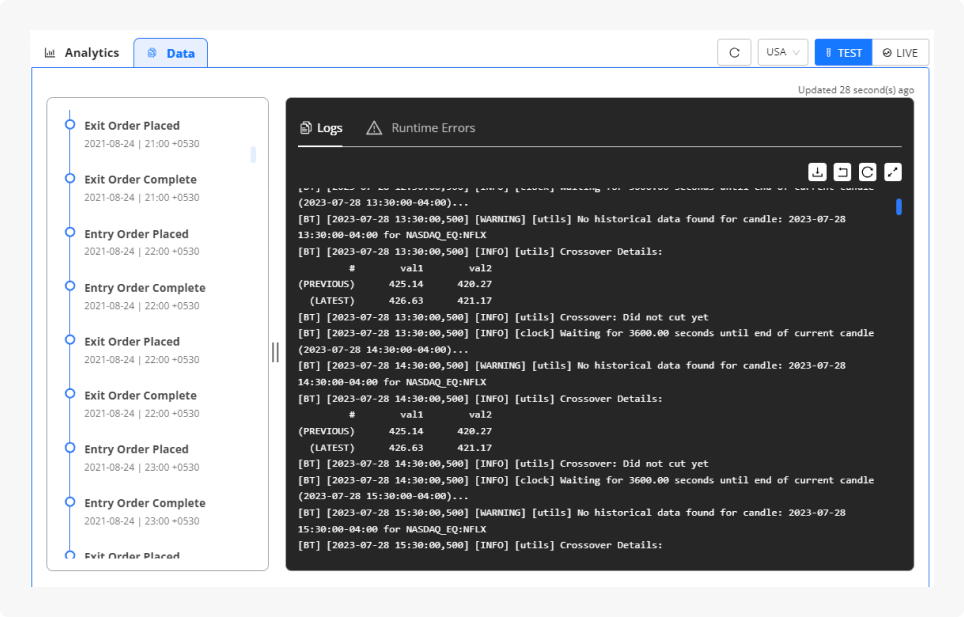
Data
Now that you have completely explored the Analytics tab, you can check out the Data tab as well. Here we have trade by trade data of all the trades, the execution logs of your strategy, and the timeline showing the events that occurred in the strategy. The execution logs display the execution stages for each candle. You can log custom debug prints by using “self.logger.info(<content>)” inside your strategy code.
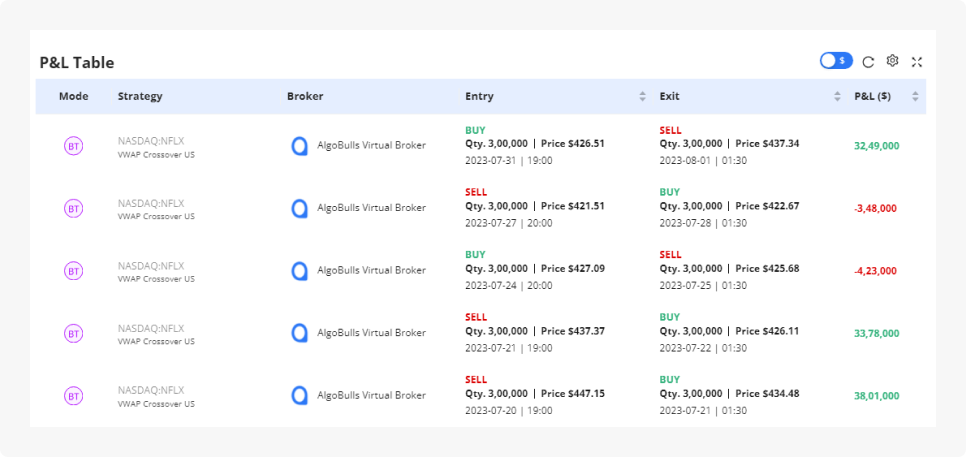
To wrap things up, we present a comprehensive trade-by-trade history in a user-friendly tabular format. This table provides details on entry and exit trades, prices, timestamps, transaction types, and trade-by-trade profit and loss. You can display these figures in either percentages or dollars.
Exploring Beyond
For those eager to replicate these metrics and charts within a Jupyter Notebook, we've developed a Python package called 'pyalgotrading' on GitHub to assist you in achieving the same.
And for those wondering if you can analyse your own trading strategies on our website, even if executed outside the AlgoBulls platform, we have a feature that will allow you to generate these metrics by simply uploading a CSV file with trade details.
This concludes our in-depth exploration of the analytics provided by AlgoBulls for every strategy. If you haven't read our previous articles in this series, you can check them all out here.
May this wealth of information empower your trading endeavors. Thank you for your time, and remember – happy trading!
Options trading is not suitable for all investors due to its inherent high risk, which can potentially result in significant losses. Please read Characteristics and Risks of Standardized Options before investing in options.
Alpaca Securities LLC and AlgoBulls are not affiliated and neither are responsible for the liabilities of the other.
Please note that this article is for educational and informational purposes only. All screenshots are for illustrative purposes only. The views and opinions expressed are those of the author and do not reflect or represent the views and opinions of Alpaca. Alpaca does not recommend any specific securities or investment strategies.
Alpaca does not prepare, edit, or endorse Third Party Content. Alpaca does not guarantee the accuracy, timeliness, completeness or usefulness of Third Party Content, and is not responsible or liable for any content, advertising, products, or other materials on or available from third party sites.
Securities brokerage services are provided by Alpaca Securities LLC ("Alpaca Securities"), member FINRA/SIPC, a wholly-owned subsidiary of AlpacaDB, Inc. Technology and services are offered by AlpacaDB, Inc.
This is not an offer, solicitation of an offer, or advice to buy or sell securities or open a brokerage account in any jurisdiction where Alpaca Securities are not registered or licensed, as applicable.
All investments involve risk and the past performance of a security, or financial product does not guarantee future results or returns. There is no guarantee that any investment strategy will achieve its objectives. Please note that diversification does not assure a profit, or protect against loss. There is always the potential of losing money when you invest in securities, or other financial products. Investors should consider their investment objectives and risks carefully before investing.
Past hypothetical backtest results do not guarantee future returns, and actual results may vary from the analysis.
The Paper Trading API is offered by AlpacaDB, Inc. and does not require real money or permit a user to transact in real securities in the market. Providing use of the Paper Trading API is not an offer or solicitation to buy or sell securities, securities derivative or futures products of any kind, or any type of trading or investment advice, recommendation or strategy, given or in any manner endorsed by AlpacaDB, Inc. or any AlpacaDB, Inc. affiliate and the information made available through Paper Trading is not an offer or solicitation of any kind in any jurisdiction where AlpacaDB, Inc. or any AlpacaDB, Inc. affiliate is not authorized to do business.