Whether you’re new to trading cryptocurrency or an experienced crypto trader, it is a good idea to have an understanding of how to trade BTC/USD, one of the most actively traded and widely analyzed cryptocurrency pairs. Whether you’re trading on the Alpaca’s dashboard, with Alpaca’s Trading API, or with Alpaca’s TradingView integration, this guide will help crypto traders navigate BTC/USD trading workflows with confidence.
We will walk through how to access charting tools, analyze price behavior, and execute trades across platforms algorithmically. By the end of this guide, readers should understand the basic tools available and how to begin integrating them into a systematic approach to crypto trading.
Before diving into the guide, make sure you’ve completed the following:
What is BTC/USD?
BTC/USD is a trading pair that shows the value of one bitcoin (BTC) in terms of US dollars (USD). It is one of the most widely traded bitcoin pairs and generally acts as a benchmark for how it is performing in the market.
When you look at the BTC/USD chart, you're seeing how the price of bitcoin has fluctuated against the US dollar over time—just like watching a stock chart. Many traders use this pair to try and capture short-term price movements, whether that means buying low or selling high.
Why BTC/USD Trading is Common for Beginners
There are several reasons why BTC/USD is often the first pair traders become familiar with when starting out in the crypto market.
1. Beginner-Friendly Tools and Clear Profit and Loss
BTC/USD may be a natural starting point for new traders because it's priced in US dollars, making it easier to understand profit and loss without needing to convert from BTC or satoshis. In addition, many popular indicators, bots, and strategy templates—especially on platforms like TradingView—are built around BTC/USD. This widespread support makes it easier to learn and experiment using familiar tools and price references.
2. Popular Charts & Analysis
The majority of widely-shared crypto trading ideas, especially on TradingView, are based on BTC/USD. Most technical patterns—such as triangles, head and shoulders, or Fibonacci retracements—are originally developed using this pair, making it a common educational reference point for beginners.
3. Simplified Setup
When trading BTC/USD, everything is priced in US dollars, making it easier to understand how much bitcoin is worth and how a trader's profit or loss translates into real money. If we're trading BTC/ETH, for example, we're measuring bitcoin’s value in ether (ETH), not dollars—so we have to track the value of both assets. By sticking with BTC/USD, we may focus on just one price (bitcoin in dollars), making the trading process more straightforward—especially for beginners who are used to thinking in fiat currency like USD.
4. Higher Liquidity & Less Slippage
BTC/USD is one of the most actively traded crypto pairs, meaning there are many buyers and sellers at any given time. This high trading volume helps keep price differences (called spreads) small and reduces the chances of getting a worse price than expected (slippage). For beginners, this often means trades go through more smoothly and at prices closer to what they see on the screen.
Basic Bitcoin Trading Strategies for Beginners
When trading BTC/USD, beginners often start with one of three common strategies, each suited to different time commitments and risk profiles.
Day Trading Approach
Day trading involves opening and closing BTC/USD positions within the same day, aiming to profit from short-term price movements. Traders may use intraday charts and technical indicators like moving averages and volume to time trades.
This style requires active monitoring and quick decision-making. It’s important to have clear entry/exit rules and use stop-loss orders to manage risk, especially in volatile crypto markets.
Swing Trading Techniques
Swing trading targets multi-day to multi-week price movements. Traders look for opportunities using tools like RSI, MACD, or Fibonacci levels to catch trends or reversals.
Swing traders who trade BTC/USD might buy when the price dips during an upward trend, or they might sell when the price hits a high point. This style of trading is usually more flexible than day trading and may still give plenty of chances to make trades.
Long-Term Investment Considerations
Long-term investors may hold BTC/USD for extended periods—often months or years—based on broader market trends or confidence in Bitcoin’s long-term value.
This strategy avoids short-term noise but still benefits from a structured plan, including staged entries, rebalancing, and awareness of macro events. Weekly charts and trend indicators may possibly help guide longer-term positions.
How to Analyze and Trade Crypto with Alpaca on TradingView
TradingView provides a variety of built-in tools and indicators that can help us analyze crypto markets more effectively. Once connected with Alpaca, these tools become part of a seamless workflow for charting and order execution.
Please note we are using BTC/USD as an example and it should not be considered investment advice.
How to connect Alpaca to TradingView account
To begin, link your Alpaca trading account with your TradingView account. You can follow the tutorial below by connecting your Alpaca account to your TradingView account. If you don’t have an Alpaca account but have a TradingView account, you can sign up for an Alpaca account now.
Using Trendlines for Bitcoin Analysis
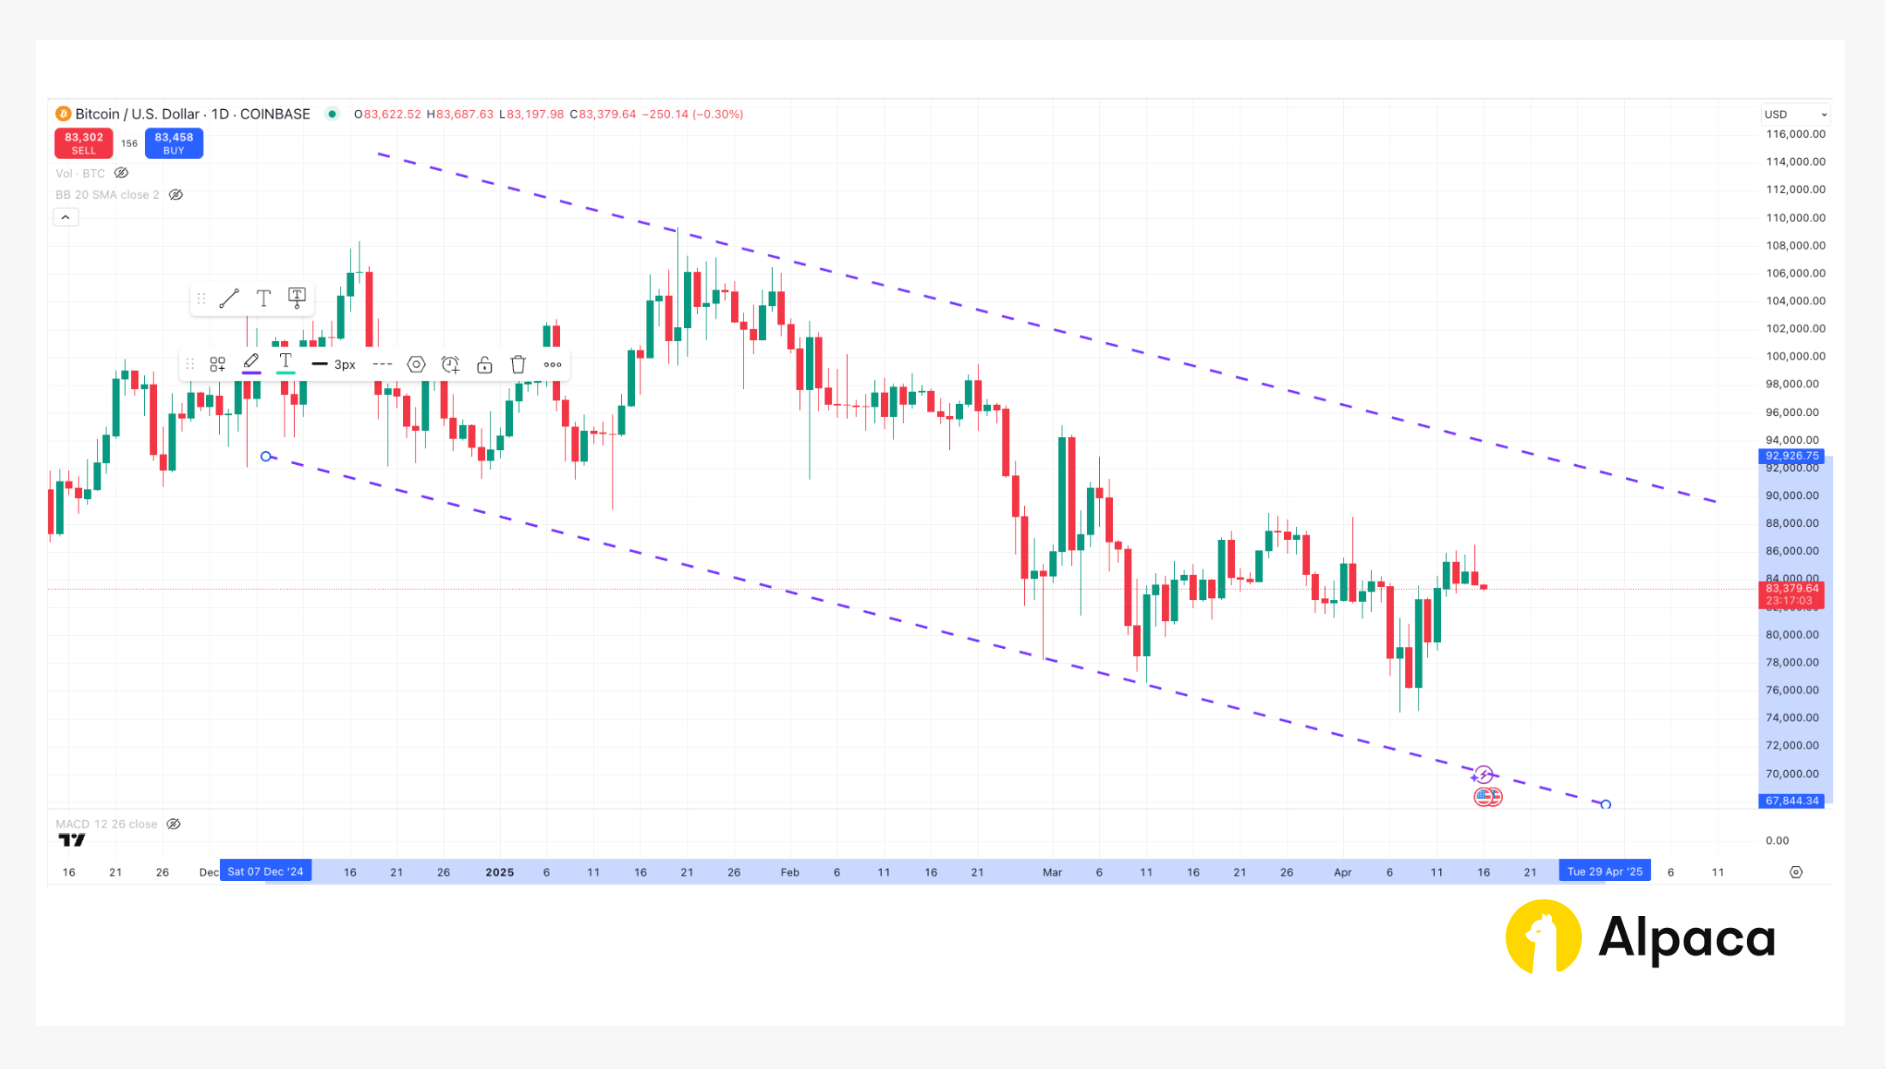
A trendline helps visualize the general direction of price movement. It’s commonly used to identify support and resistance zones in both uptrends and downtrends. The chart below displays BTC/USD price action on a daily timeframe. Two parallel trendlines define a descending price channel, capturing a series of lower highs and lower lows over an extended period. Descending channels like this are commonly used to monitor trend continuation or assess potential breakout scenarios.
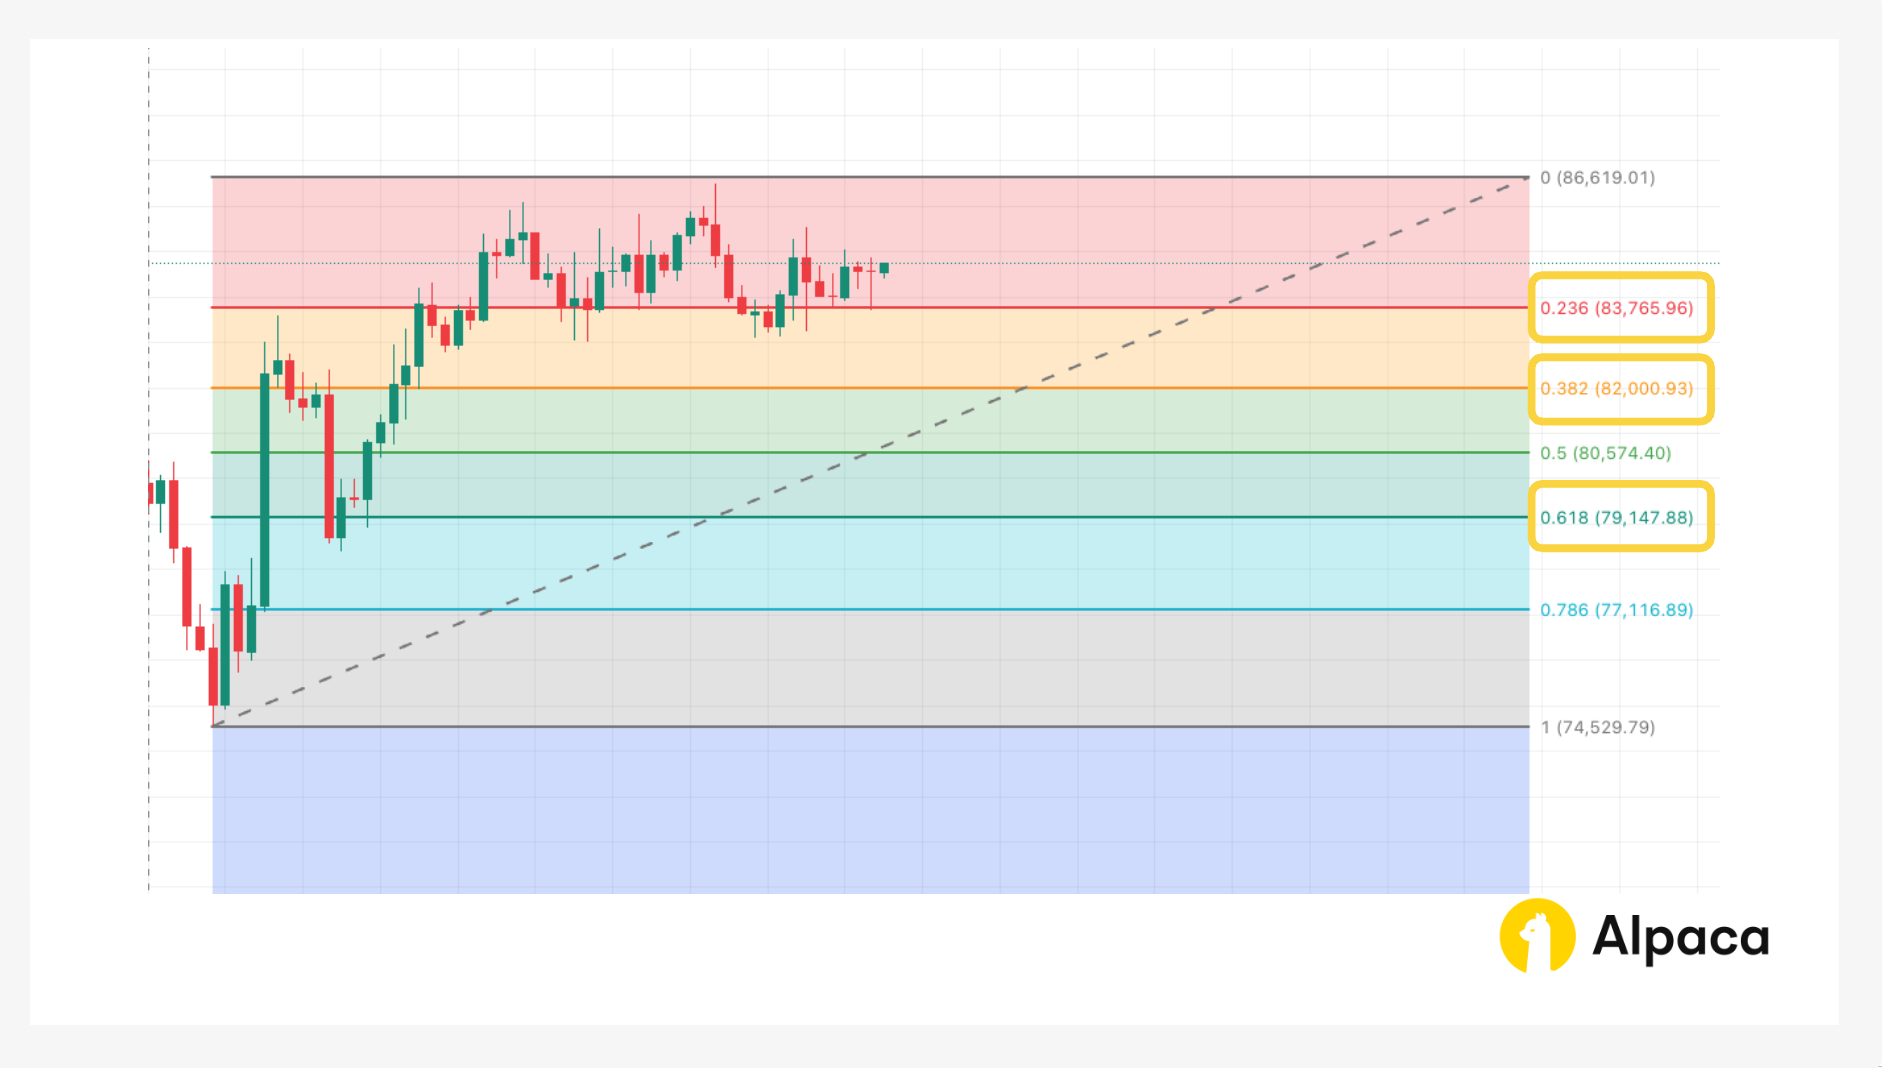
Bitcoin Analysis with Fibonacci Retracement
Fibonacci retracement is a technical tool used to identify potential support or resistance levels during pullbacks in a trending market. It’s drawn between a recent high and low, marking key levels like 38.2%, 50%, and 61.8% where price may temporarily reverse.
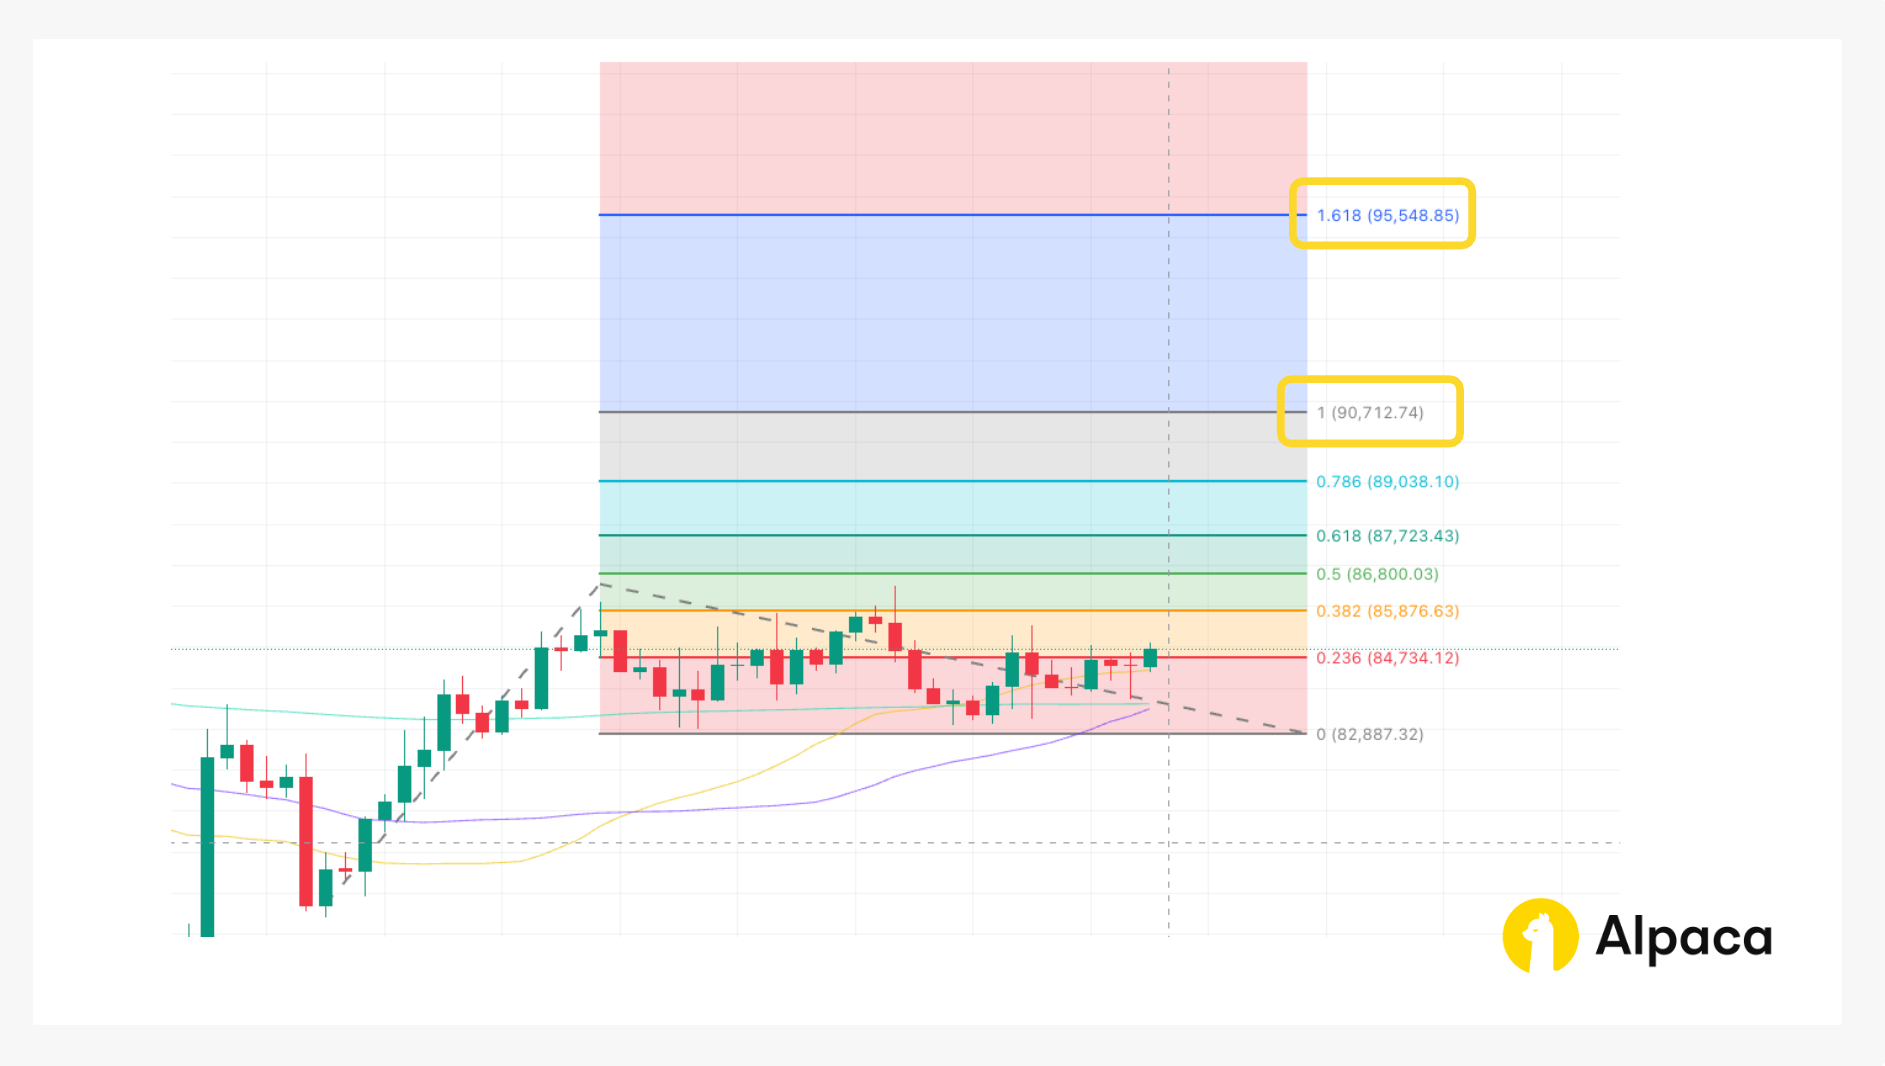
Trend-based Fibonacci Extension for BTC/USD
Trend-based Fibonacci Expansion is a tool that projects how far a bullish or bearish trend may extend using Fibonacci ratios. By anchoring to key price points—such as the trend’s start, its initial move, and the corrective leg—it helps estimate future target levels. Traders may use long-term moving averages, like the 35, 50, or 200-period SMA, to validate the broader trend before applying this tool. Common Fibonacci extension levels include 1.0 as a conservative target and 1.618 as a widely used sweet spot for trend continuation.
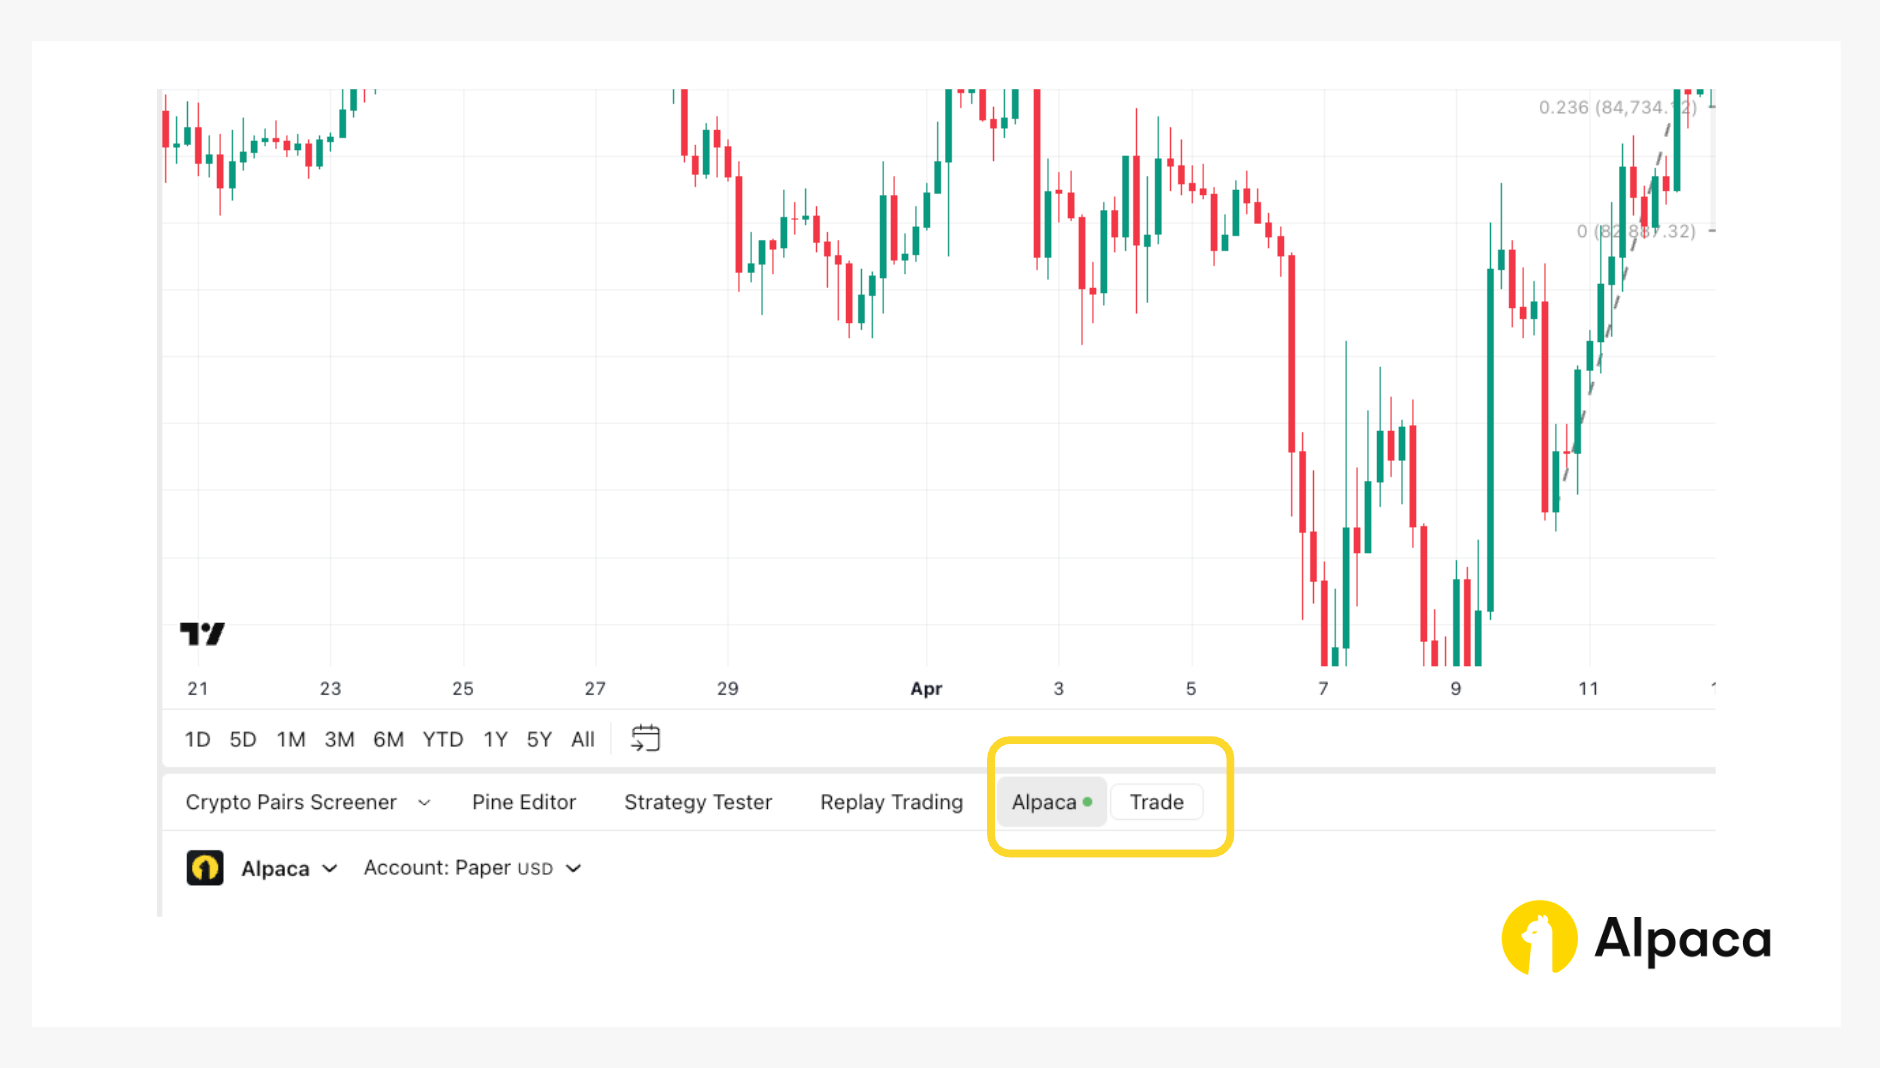
Purchase BTC/USD Using Alpaca's TradingView Extension
Once Alpaca’s Trading API is connected, traders can place buy and sell orders directly through TradingView’s terminal. The trading panel with Alpaca integration can be opened below the TradingView Superchart.
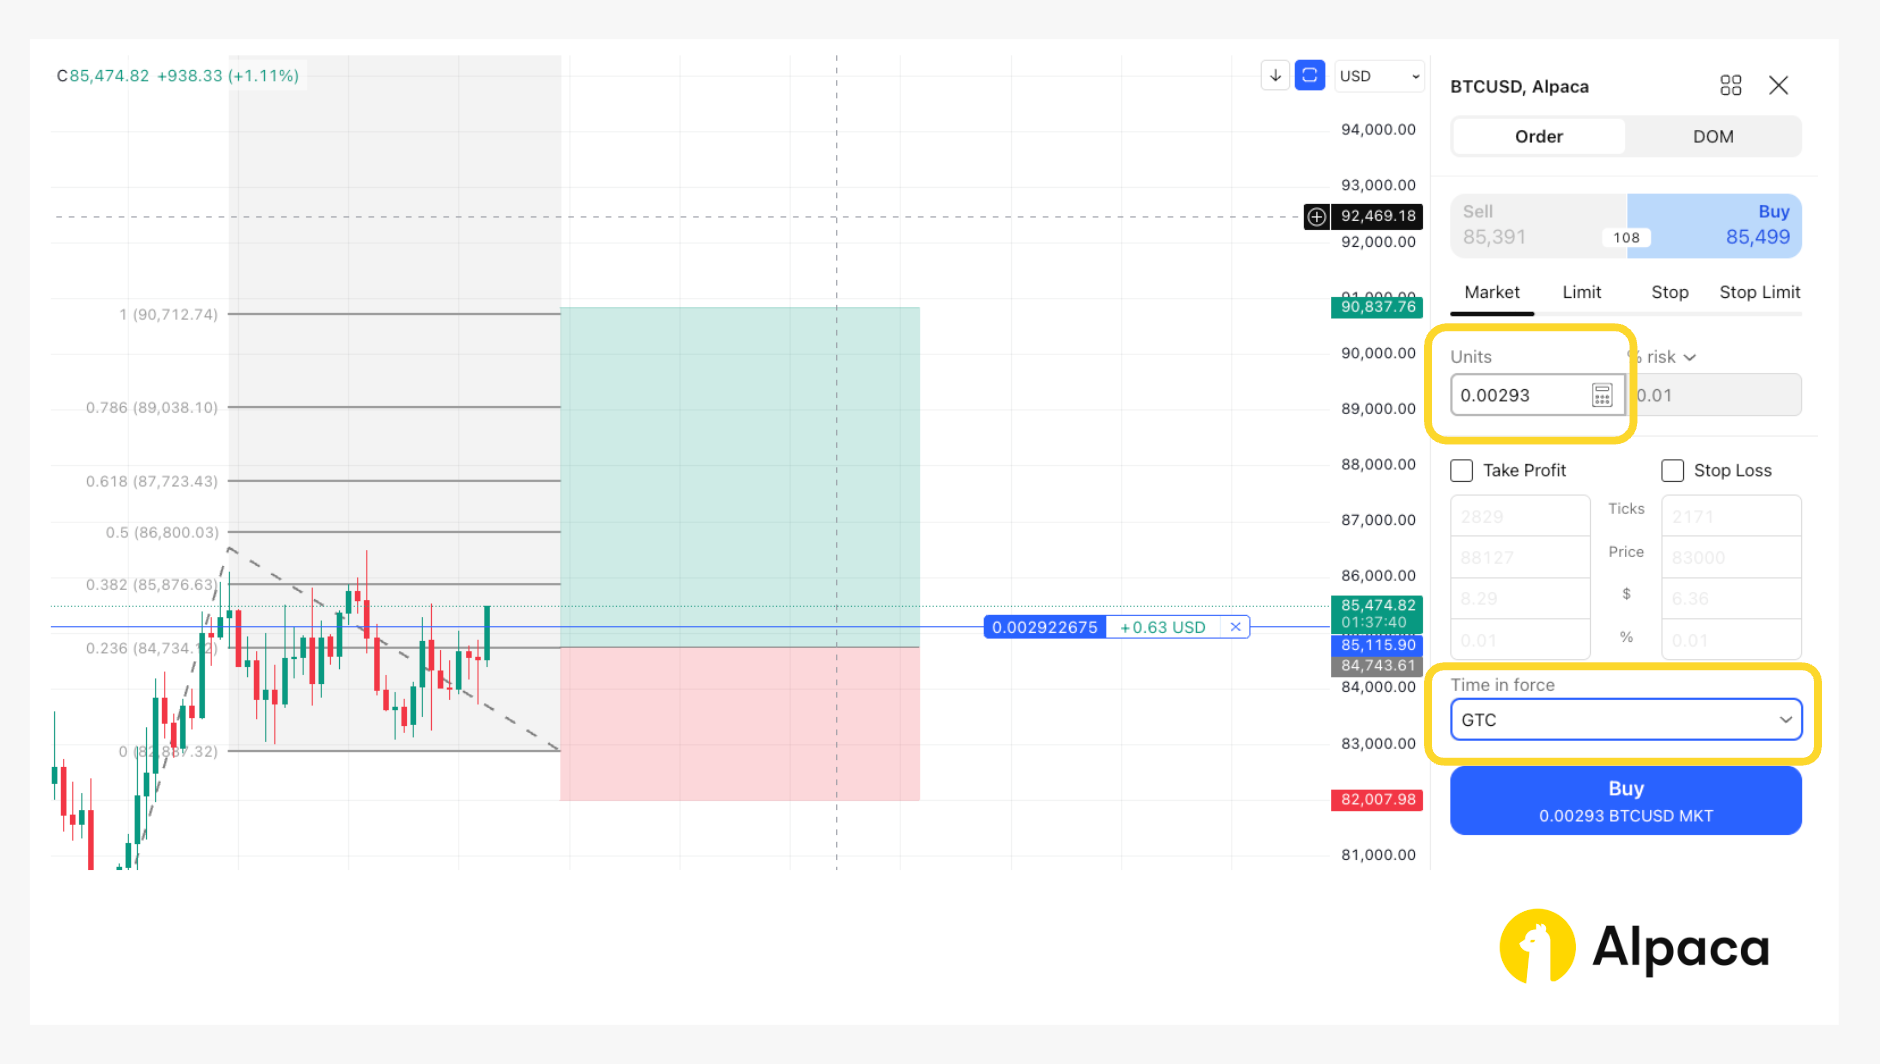
The Long Position tool on TradingView provides a visual way to structure trades. In the example below, we select “0.00293” units so that the total trade amount is approximately $250 (84,740 × 0.00293 ≈ 250).
Note: When placing a market order through TradingView’s Order Panel with Alpaca, traders may still see the option to configure a “stop-loss” or “take-profit". However, these settings are not supported for market orders, and if selected, the order will be rejected upon submission. Similarly, the only available “Time in Force” options are “GTC (Good till Canceled)” and “IOC (Immediate or Cancel)”—the commonly used “DAY” option is not supported. Traders should double-check these parameters to avoid unintentional order failures.
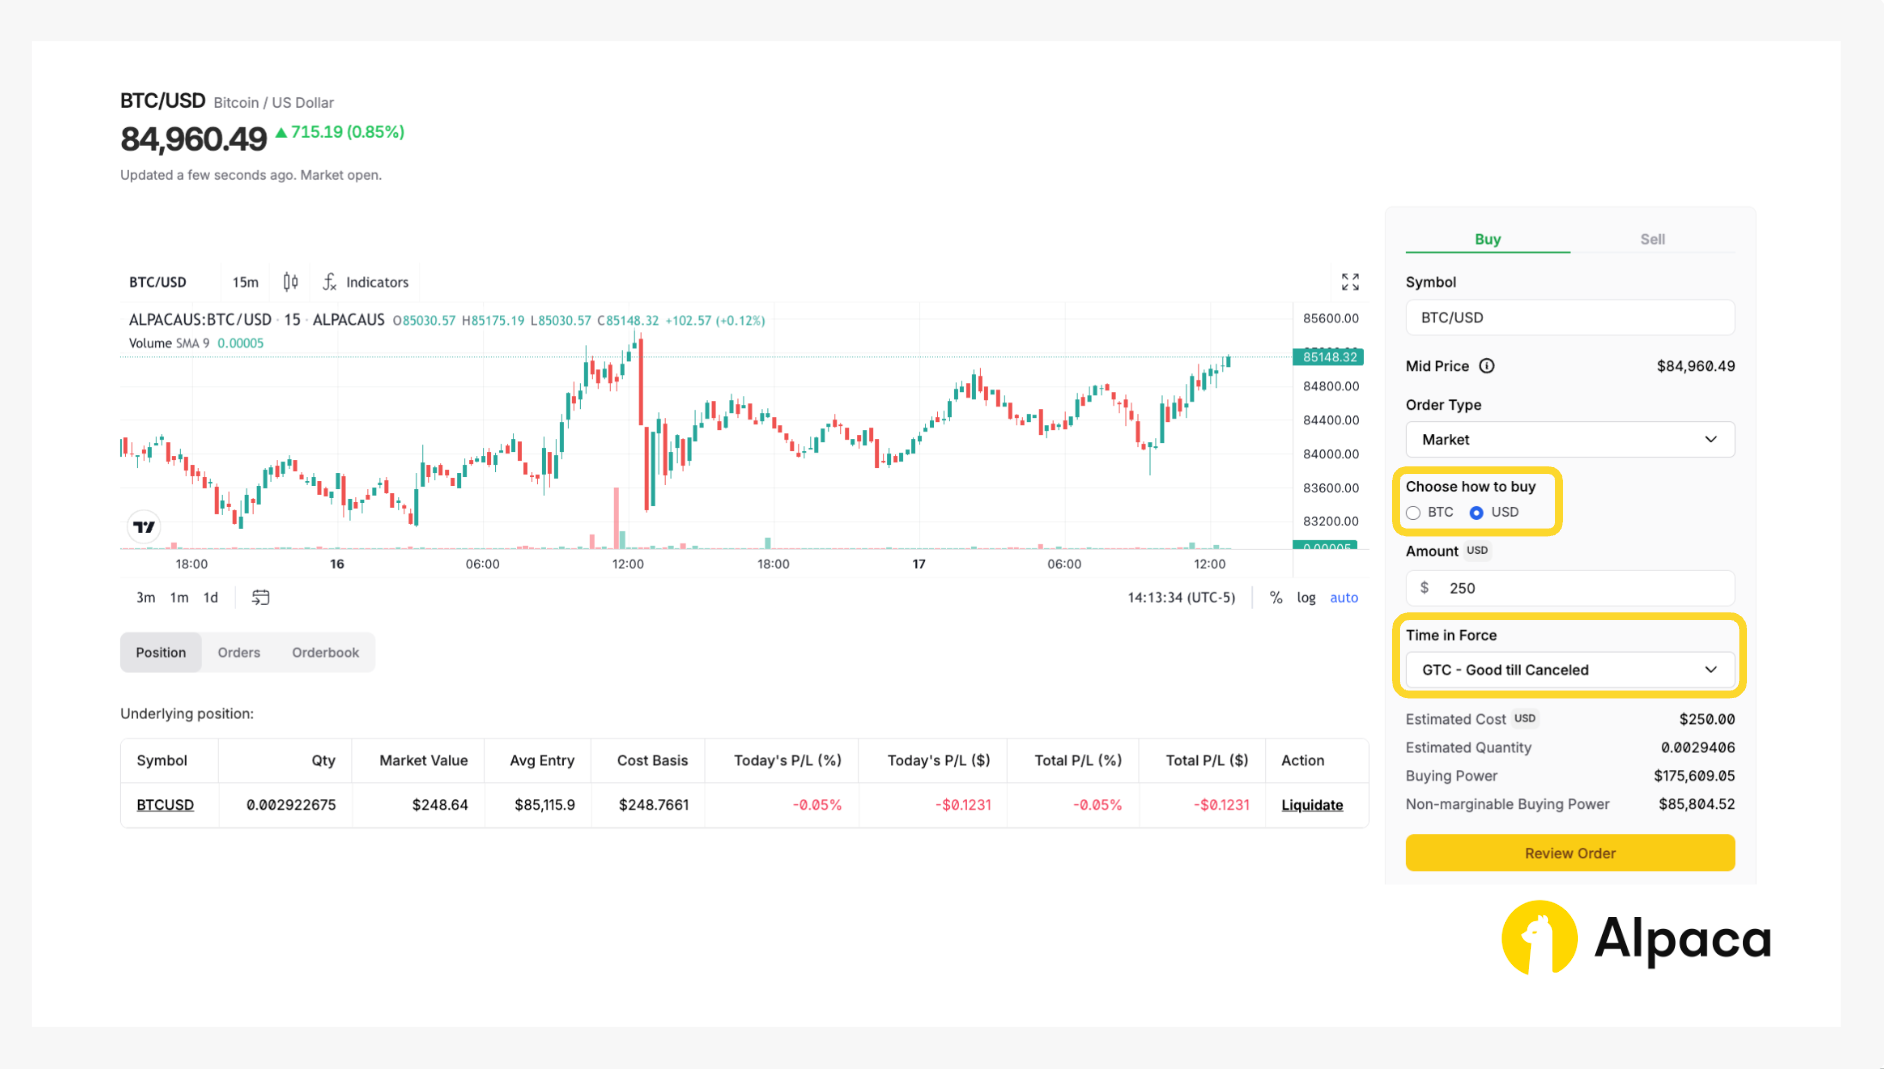
How to Trade BTC/USD on Alpaca’s Dashboard
Traders can also place BTC/USD orders directly through Alpaca’s web dashboard. After signing up, navigate to the Trading page to access crypto order entry.
How to Place a Trade
- Step 1: Select BTC/USD using the symbol search bar to select the BTC/USD pair.
- Step 2: Choose how you want to buy. Traders can enter either a BTC quantity or a USD amount (e.g., $250) to define position size.
- Step 3: Set Order Type and Time in Force. Choose an order type (e.g., Market or Limit), then select a time in force like GTC (Good till Canceled) or IOC (Immediate or Cancel). Note: DAY orders are not available for crypto trades on the dashboard.
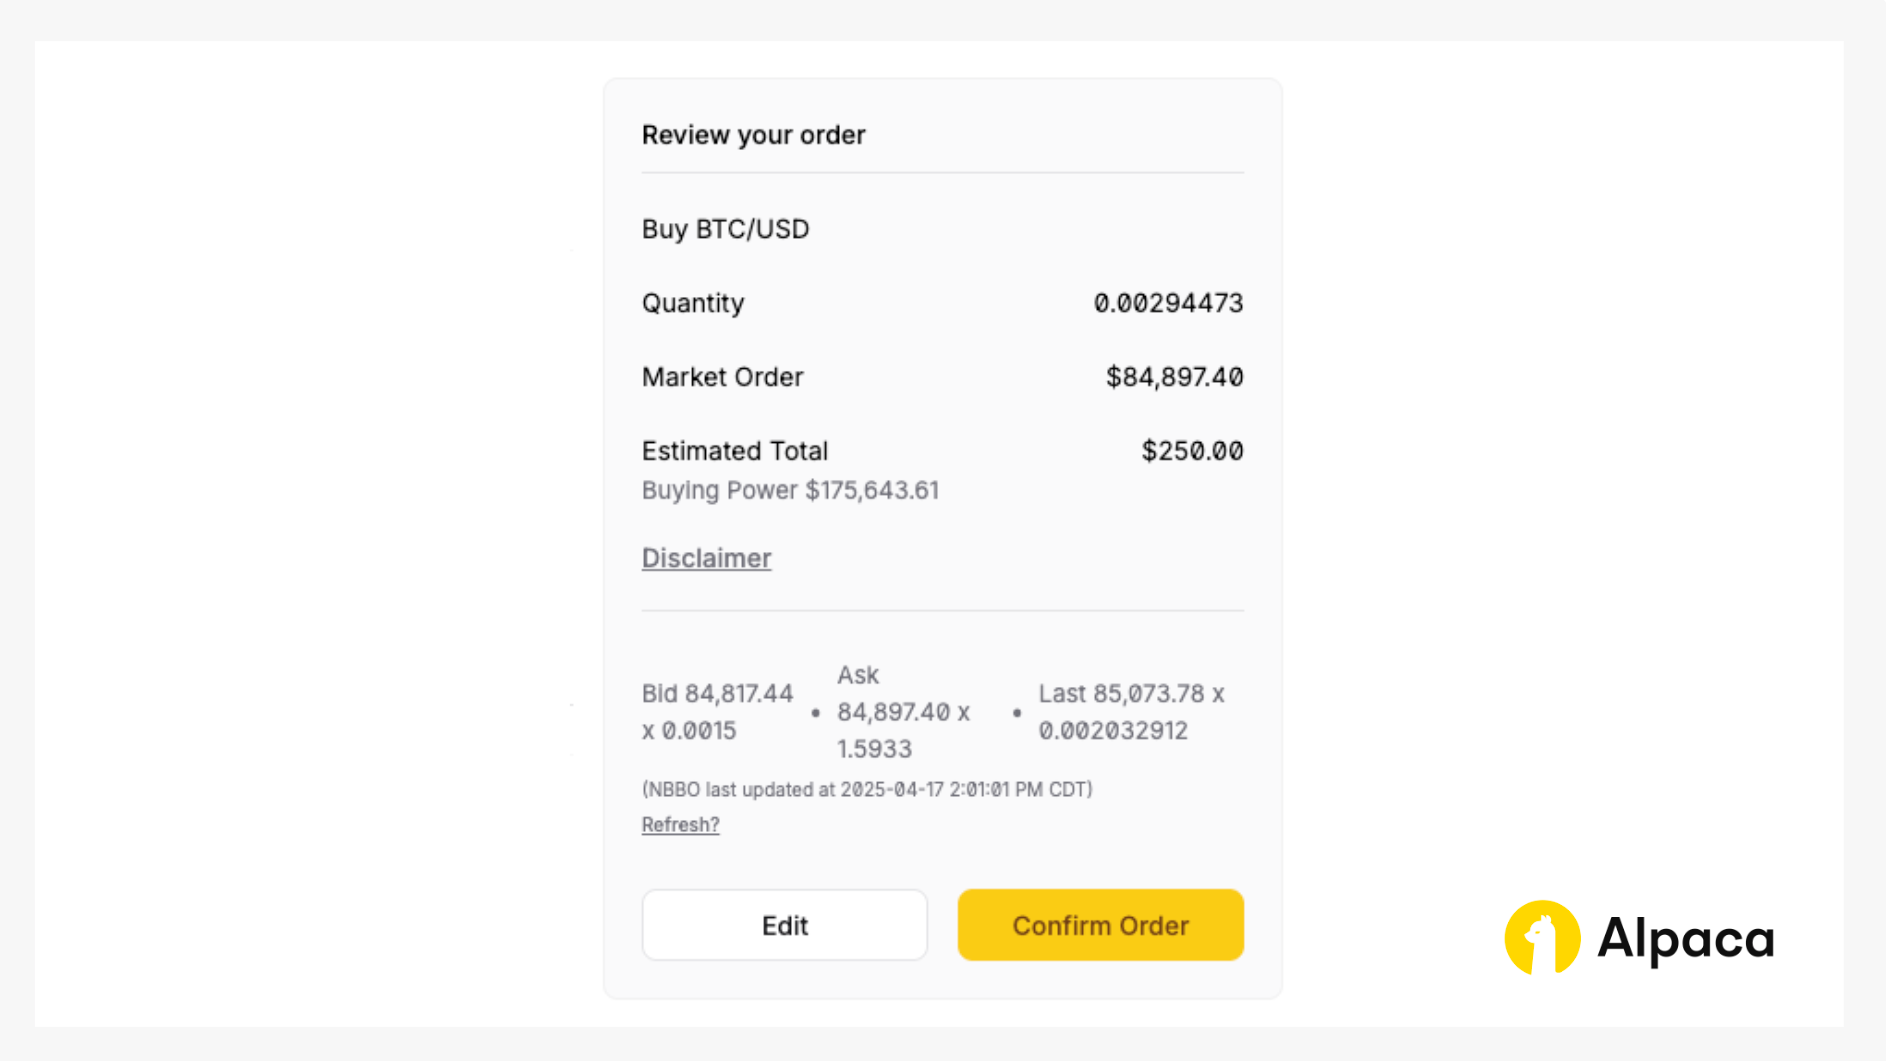
- Step 4: Click “Review Order” to confirm details, then “Confirm Order” to execute.
Troubleshooting Tips
- Orders may be rejected if buying power is insufficient or settings are incompatible with market conditions.
- IOC orders may partially fill or cancel depending on available liquidity.
- Switching between BTC and USD inputs might affect quantity so please double-check before submitting.
You’ll then be prompted to confirm the order.

Algorithmic Crypto Trading: Using Python with Alpaca's Trading API
This section provides a step-by-step guide to implementing crypto trading using Python and Alpaca’s Trading API in the Paper Trading environment.
Before diving into the guide, make sure you’ve completed the following:
Step1: Setting Up the Bitcoin Trading Environment
The first step involves configuring the environment for crypto trading and specifying your Alpaca Paper Trading API keys. This ensures your API connections and variable setup are secure and streamlined for data retrieval and trading in operations.
Note: While we are using Jupyter Notebook for this tutorial, you can use Google Collab or any other IDE as your code environment. You can also find all of the below code on Alpaca’s Github page.
# Install or upgrade the package `alpaca-py` and import it
!python3 -m pip install --upgrade alpaca-py
# Install or upgrade the package `pandas-ta`
!python3 -m pip install -U git+https://github.com/twopirllc/pandas-ta

# Import standard library modules
from datetime import datetime, timedelta
from zoneinfo import ZoneInfo

# Import third-party modules
import numpy as np
import pandas as pd
import pandas_ta as ta  # The installment of pandas-ta may be tricky. Please find the pypi page here (https://pypi.org/project/pandas-ta/)
import matplotlib.pyplot as plt

# Import Alpaca modules
import alpaca
from alpaca.data.historical.crypto import CryptoHistoricalDataClient
from alpaca.data.requests import (
    CryptoBarsRequest,
    CryptoLatestQuoteRequest,
    CryptoQuoteRequest,
    CryptoTradesRequest,
)
from alpaca.data.timeframe import TimeFrame, TimeFrameUnit
from alpaca.trading.client import TradingClient
from alpaca.trading.enums import (
    AssetClass,
    AssetStatus,
    OrderSide,
    OrderType,
    QueryOrderStatus,
    TimeInForce,
)
from alpaca.trading.requests import LimitOrderRequest, MarketOrderRequest
The script initializes Alpaca clients for trading crypto, as well as for handling data requests.
# Please change the following to your own PAPER api key and secret
# You can get them from https://alpaca.markets/
API_KEY = "<YOUR PAPER API KEY>"
API_SECRET = "<YOUR PAPER API SECRET>"

#### We use paper environment for this example ####
PAPER = True # Please do not modify this. This example is for paper trading only.
####

# Below are the variables for development this documents
# Please do not change these variables
trade_api_url = None
trade_api_wss = None
data_api_url = None
stream_data_wss = None

# setup trading clients
trade_client = TradingClient(api_key=API_KEY, secret_key=API_SECRET, paper=PAPER, url_override=trade_api_url)
# setup crypto historical data client
crypto_historical_data_client = CryptoHistoricalDataClient(api_key=API_KEY, secret_key=API_SECRET)
Step 2: Executing Market Data Analysis
Defines the trading pair (BTC/USD). There are limitations on order types and time in force for crypto trading with Alpaca’s Trading API.
# we will place orders which Alapca trading platform supports
# - order types for crypto: market, limit, stop_limit
# - time_in_force for crypto: gtc, ioc.
# please refer to the following documents for more details
# ref. https://docs.alpaca.markets/docs/orders-at-alpaca
# ref. https://docs.alpaca.markets/reference/postorder

# we will place orders for symbol: BTC/USD in this example
symbol = "BTC/USD"
We can set the timezone, get the current date, define the start and end dates for historical data, and retrieve historical Bitcoin price data using the CryptoBarsRequest method from Alpaca’s Trading API.
# Set the timezone
timezone = ZoneInfo('America/New_York')

# Get current date in US/Eastern timezone
today = datetime.now(timezone).date()

# Define the start and end dates for the historical period
start_date = today - timedelta(days=365 * 2)
end_date = today - timedelta(days=1)

# Create the request object
req = CryptoBarsRequest(
    symbol_or_symbols = [symbol],
    timeframe=TimeFrame.Day,
    start=start_date,
    end_date=end_date,
)

bars_date = crypto_historical_data_client.get_crypto_bars(req).df.reset_index(level='symbol', drop=True)

df = bars_date.copy()
df.head()
We calculate Exponential Moving Averages (EMAs) using the ewm() method in pandas.
# Define Exponential Moving Average (EMA) periods
short_window = 12 # Common short-term period
long_window = 26  # Common long-term period

# Calculate EMA using pandas.ewm()
# 'span' is related to the period N, often approximated as span = N for typical EMA calculations.
# 'adjust=False' uses a standard recursive formula common in technical analysis.
df["ema_short"] = df["close"].ewm(span=short_window, adjust=False).mean()
df["ema_long"] = df["close"].ewm(span=long_window, adjust=False).mean()
We also calculate a Simple Moving Average (SMA).
# Calculate Simple Moving Average (SMA) using rolling() with 50-day SMA
sma_window = 50
df["sma"] = df["close"].rolling(window=sma_window).mean()
df[["close", "sma"]].tail()
Calculates the Average True Range (ATR) and the Average Directional Index (ADX) using the “pandas_ta” library.
# Calculate Average True Range (ATR) - requires high, low, close columns
# Default length is 14 periods
df.ta.atr(length=14, append=True) # Appends 'ATR_14' column
# Calculate Average Directional Index (ADX) - requires high, low, close
# Default length is 14 periods
# Note: ta.adx() returns ADX, Positive Directional Movement (DMP), and Negative Directional Movement (DMN)
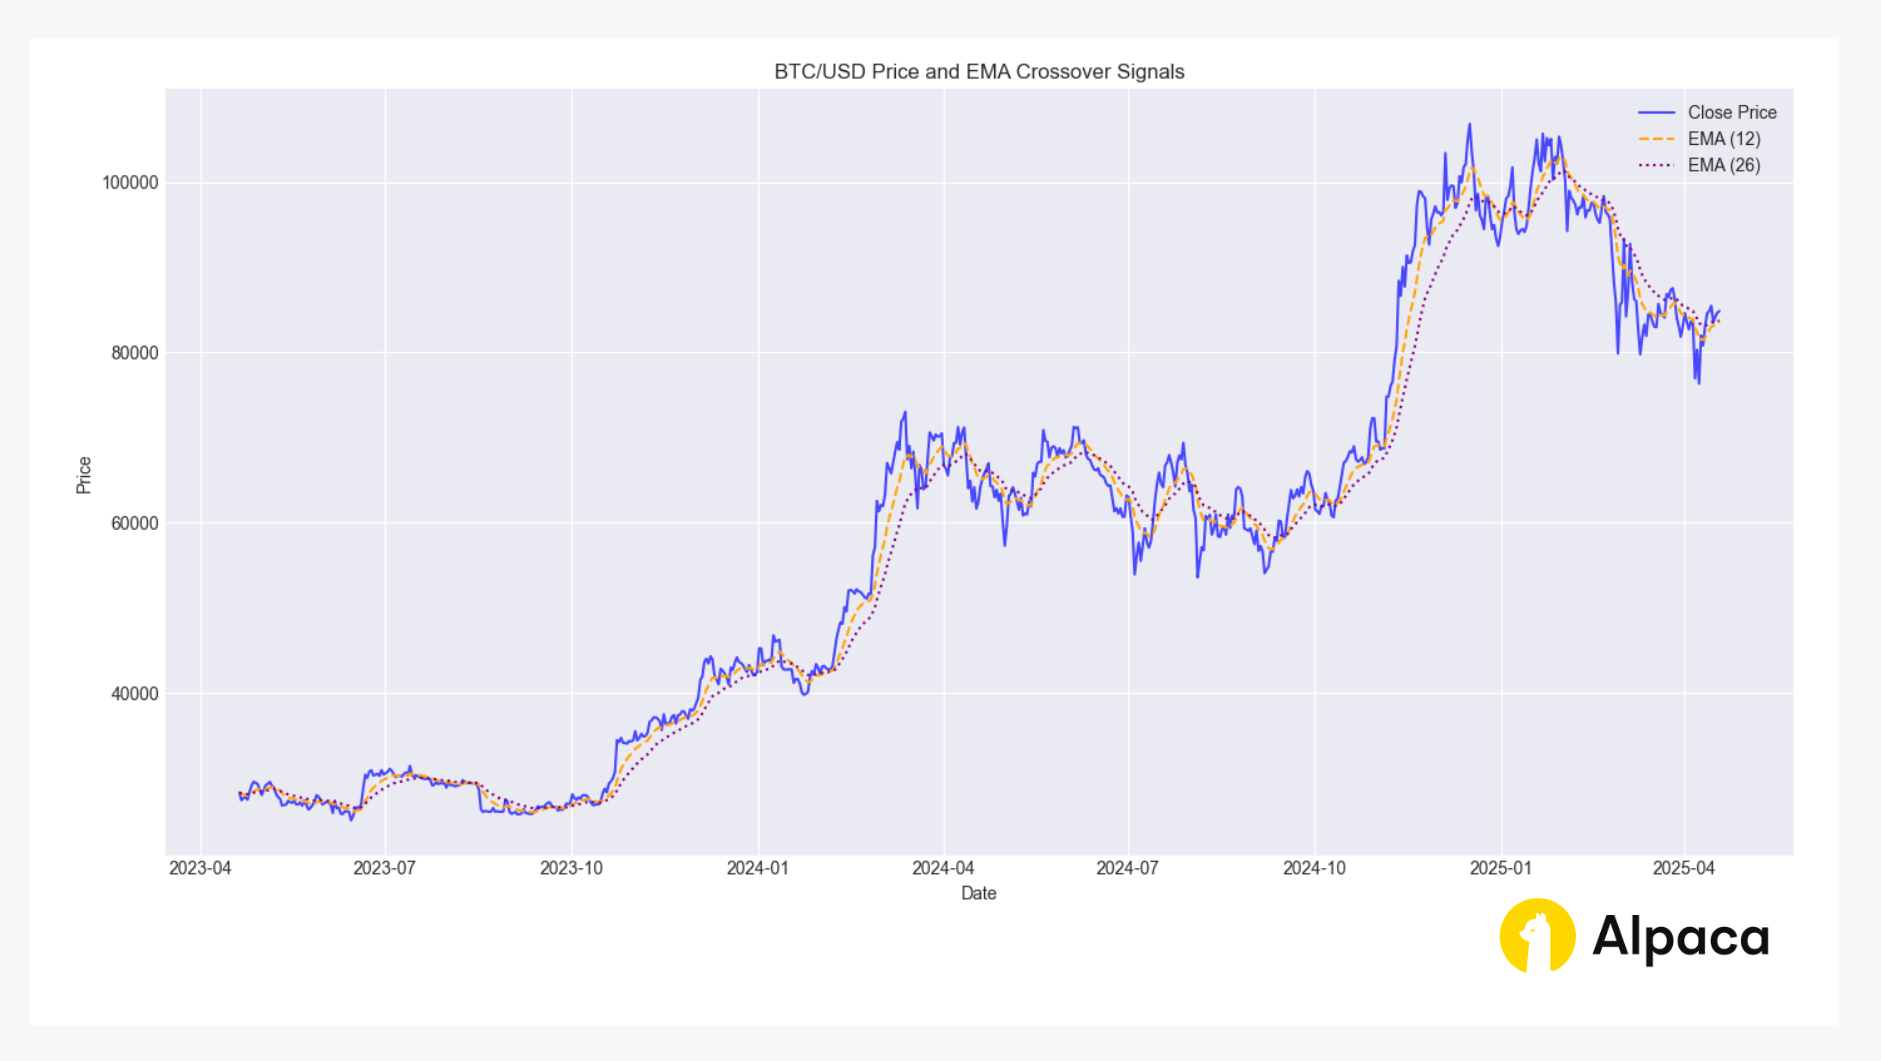
df.ta.adx(length=14, append=True) # Appends 'ADX_14', 'DMP_14', 'DMN_14' columnsUses matplotlib.pyplot (or plt) to plot the closing price and EMAs. Conditionally plots buy and sell signals using plt.scatter() if they exist in the DataFrame.
if not df.empty and 'ema_short' in df.columns and 'ema_long' in df.columns:
    plt.style.use('seaborn-v0_8-darkgrid') # Use a visually appealing style
    plt.figure(figsize=(14, 7))

    plt.plot(df.index, df['close'], label='Close Price', color='blue', alpha=0.7)
    plt.plot(df.index, df['ema_short'], label=f'EMA ({short_window})', color='orange', linestyle='--')
    plt.plot(df.index, df['ema_long'], label=f'EMA ({long_window})', color='purple', linestyle=':')

    # Optional: Add crossover points visually
    buy_signals = df[df['buy_signal']] if 'buy_signal' in df else pd.DataFrame()
    sell_signals = df[df['sell_signal']] if 'sell_signal' in df else pd.DataFrame()

    if not buy_signals.empty:
        plt.scatter(buy_signals.index, buy_signals['close'], label='Buy Signal', marker='^', color='green', s=100, zorder=5)
    if not sell_signals.empty:
        plt.scatter(sell_signals.index, sell_signals['close'], label='Sell Signal', marker='v', color='red', s=100, zorder=5)

    plt.title(f'{symbol} Price and EMA Crossover Signals')
    plt.xlabel("Date")
    plt.ylabel("Price")
    plt.legend()
    plt.tight_layout() # Adjust layout to prevent labels overlapping
    plt.show()
else:
    print("Cannot plot: DataFrame is empty or EMA columns are missing.")
This code returns the bar chart like in the image below.
Step 3: Creating a Bitcoin Swing Trading Algorithm with EMAs
Generates buy and sell signals based on EMA crossovers using pandas' logical operations and the .shift() method to compare current and previous EMA values.
# Generate Buy Signal
# Condition 1: Is the short EMA currently above the long EMA?
currently_above = df['ema_short'] > df['ema_long']
# Condition 2: Was the short EMA below or equal to the long EMA on the previous bar?
previously_below_or_equal = df['ema_short'].shift(1) <= df['ema_long'].shift(1)
# Buy Signal: True only on the bar where the crossover *just* happened
df['buy_signal'] = currently_above & previously_below_or_equal

# Generate Sell Signal
# Condition 1: Is the short EMA currently below the long EMA?
currently_below = df['ema_short'] < df['ema_long']
# Condition 2: Was the short EMA above or equal to the long EMA on the previous bar?
previously_above_or_equal = df['ema_short'].shift(1) >= df['ema_long'].shift(1)
# Sell Signal: True only on the bar where the crossover *just* happened
df['sell_signal'] = currently_below & previously_above_or_equal

# Display rows where signals occurred
print("\nCrossover Signal Occurrences:")
signal_rows = df[df['buy_signal'] | df['sell_signal']]
if not signal_rows.empty:
    print(signal_rows[['close', 'ema_short', 'ema_long', 'buy_signal', 'sell_signal']])
else:
    print("No crossover signals found in the data.")
Retrieves the latest data row using df.iloc[-1].
# Store the latest signal information for potential execution
latest_data = df.iloc[-1]
print("\nLatest Data Row:")
latest_data[['close', 'ema_short', 'ema_long', 'buy_signal', 'sell_signal']]
Step 4: Purchasing BTC/USD using Python with Alpaca's Trading API
Submitting Simple Market Orders
Creates a MarketOrderRequest object to define the market order parameters (symbol, notional, side, type, time_in_force) and submits the order using trade_client.submit_order(req).
# simple, market order, notional
req = MarketOrderRequest(
    symbol = symbol,
    notional = 250,  # notional is specified in USD, here we specify $250
    side = OrderSide.BUY,
    type = OrderType.MARKET,
    time_in_force = TimeInForce.GTC,
)
res = trade_client.submit_order(req)
res
Submitting Limit Order Requests
Defines a function get_latest_quote(symbol) that creates a CryptoLatestQuoteRequest and uses crypto_historical_data_client.get_crypto_latest_quote(req) to get the latest quote for a symbol (=”BTC/USD”).
# Function to get latest quotes by symbol
def get_latest_quote(symbol):
    req = CryptoLatestQuoteRequest(symbol_or_symbols = [symbol])
    res = crypto_historical_data_client.get_crypto_latest_quote(req)
    return res

# Get latest quotes
btc_quote = get_latest_quote("BTC/USD")
Defines a function calc_cost(quote, qty) to calculate the total cost of an order.
# Get the estimated buying cost of BTC/USD with given qty
def calc_cost(quote, qty):
    # Calculate total cost of BTC/USD order and round to 4 decimal places
    total_cost = round(qty * quote[symbol].ask_price, 4)
    return total_cost

QTY = 0.003
cost = calc_cost(btc_quote, qty=QTY)
f"The total cost of BTC/USD order for qtry={QTY} is ${cost}"
Calculates a limit price based on the current ask price from the quote and the specified limit range.
# Define a 6% range around the crypto price
LIMIT_RANGE = 0.06

# Calculate the limit price as 6% below the current ask price
limit_price = btc_quote[symbol].ask_price * (1 - LIMIT_RANGE)
f"The limit price for BTC/USD 'BUY' order for qty={QTY} is ${limit_price}"
Creates a LimitOrderRequest object to define the limit order parameters. Submits the limit order using trade_client.submit_order(req).
# simple, market order, notional
req = LimitOrderRequest(
    symbol=symbol,
    qty=QTY,
    limit_price = limit_price,
    side=OrderSide.BUY,
    type = OrderType.LIMIT,
    time_in_force=TimeInForce.GTC, # TIF=DAY is not available
)

res = trade_client.submit_order(req)
res
Conclusion
Trading BTC/USD is a popular starting point in cryptocurrency trading due to its liquidity, USD pricing, and readily available analysis tools. Traders may possibly employ various strategies, including day trading, swing trading, and long-term investment, depending on their risk tolerance and time commitment. Platforms like TradingView, integrated with Alpaca, offer robust charting and execution capabilities for both manual and algorithmic trading. Alpaca's Trading API further enables developers to automate strategies, such as bull call spreads.
However, it's crucial to remember that all trading involves risk, and cryptocurrency markets are particularly volatile. Effective risk management, a clear trading plan, and staying informed are essential.
We hope you've found this tutorial on how to trade “BTC/USD” in real-time with Alpaca’s Trading API, dashboard, or TradingView integration insightful and useful for getting started on your own strategy. As we put these concepts into practice, feel free to share your feedback and experiences on our forum, Slack community, or subreddit! And don’t forget to check out the rest of our crypto-trading tutorials.
For those looking to integrate crypto trading with Alpaca’s Trading API, here are some additional resources:
- Sign up for an Alpaca Trading API account
- How to Connect to Alpaca's Trading API
- How to Start Paper Trading with Alpaca's Trading API
- How To Trade Crypto Using Machine Learning
- Buying Crypto using Alpaca Snapshot and Crypto APIs
- How to Build a Trading Bot with Alpaca and Trellis
Frequently Asked Questions
What is bitcoin trading and how does it work?
Bitcoin trading involves buying and selling Bitcoin to potentially profit from its price changes. We might observe price charts and consider when to buy or sell. Trading is often done on platforms like Alpaca and TradingView, either manually or using automated systems. Bitcoin is often traded against the US dollar (BTC/USD).
Is bitcoin trading profitable for beginners?
Bitcoin trading may be profitable, but it also carries significant risk. Potential profits depend on market changes, trading strategy, and risk management. We suggest beginners start with small amounts to learn before investing more substantial capital.
How much money do you need to start trading BTC/USD?
The amount of money needed to start trading Bitcoin varies by platform. You can start trading BTC/USD with as little as “0.0001 BTC” on Alpaca’s Trading platform. Alpaca allows us to specify a USD amount (like $250) for our trade size. We recommend starting with an amount we're comfortable potentially losing.
What tools do professional bitcoin traders use?
Traders often use:
- Charting tools like TradingView to analyze prices.
- APIs (like Alpaca's Trading API) to automate trades.
- Technical indicators (RSI, MACD, etc.) for market analysis.
- Software to manage orders and data.
- Programming (Python) for building trading bots.
Alpaca Securities LLC and TradingView are not affiliated and neither are responsible for the liabilities of the other.
Please note that this article is for general informational purposes only and is believed to be accurate as of the posting date but may be subject to change. The examples above are for illustrative purposes only.
Alpaca does not prepare, edit, or endorse Third Party Content. Alpaca does not guarantee the accuracy, timeliness, completeness or usefulness of Third Party Content, and is not responsible or liable for any content, advertising, products, or other materials on or available from third party sites.
All investments involve risk, and the past performance of a security, or financial product does not guarantee future results or returns. There is no guarantee that any investment strategy will achieve its objectives. Please note that diversification does not ensure a profit, or protect against loss. There is always the potential of losing money when you invest in securities, or other financial products. Investors should consider their investment objectives and risks carefully before investing.
Cryptocurrency is highly speculative in nature, involves a high degree of risks, such as volatile market price swings, market manipulation, flash crashes, and cybersecurity risks. Cryptocurrency regulations are continuously evolving, and it is your responsibility to understand and abide by them. Cryptocurrency trading can lead to large, immediate and permanent loss of financial value. You should have appropriate knowledge and experience before engaging in cryptocurrency trading. For additional information, please click here.
The Paper Trading API is offered by AlpacaDB, Inc. and does not require real money or permit a user to transact in real securities in the market. Providing use of the Paper Trading API is not an offer or solicitation to buy or sell securities, securities derivative or futures products of any kind, or any type of trading or investment advice, recommendation or strategy, given or in any manner endorsed by AlpacaDB, Inc. or any AlpacaDB, Inc. affiliate and the information made available through the Paper Trading API is not an offer or solicitation of any kind in any jurisdiction where AlpacaDB, Inc. or any AlpacaDB, Inc. affiliate (collectively, “Alpaca”) is not authorized to do business.
Securities brokerage services are provided by Alpaca Securities LLC ("Alpaca Securities"), member FINRA/SIPC, a wholly-owned subsidiary of AlpacaDB, Inc. Technology and services are offered by AlpacaDB, Inc.
Cryptocurrency services are made available by Alpaca Crypto LLC ("Alpaca Crypto"), a FinCEN registered money services business (NMLS # 2160858), and a wholly-owned subsidiary of AlpacaDB, Inc. Alpaca Crypto is not a member of SIPC or FINRA. Cryptocurrencies are not stocks and your cryptocurrency investments are not protected by either FDIC or SIPC. Please see the Disclosure Library for more information.
This is not an offer, solicitation of an offer, or advice to buy or sell securities or cryptocurrencies or open a brokerage account or cryptocurrency account in any jurisdiction where Alpaca Securities or Alpaca Crypto, respectively, are not registered or licensed, as applicable.