Chart patterns serve as great technical analysis tools for traders aiming to observe potential market movements. Among these patterns, the head and shoulders pattern is significant for its potential of signaling trend reversals. This guide explores key aspects of the head and shoulders pattern, including its structure, variations, advantages, limitations, and practical applications using platforms like Alpaca and TradingView.
Before diving into the guide, make sure you’ve completed the following:
What is a Head and Shoulders Pattern?
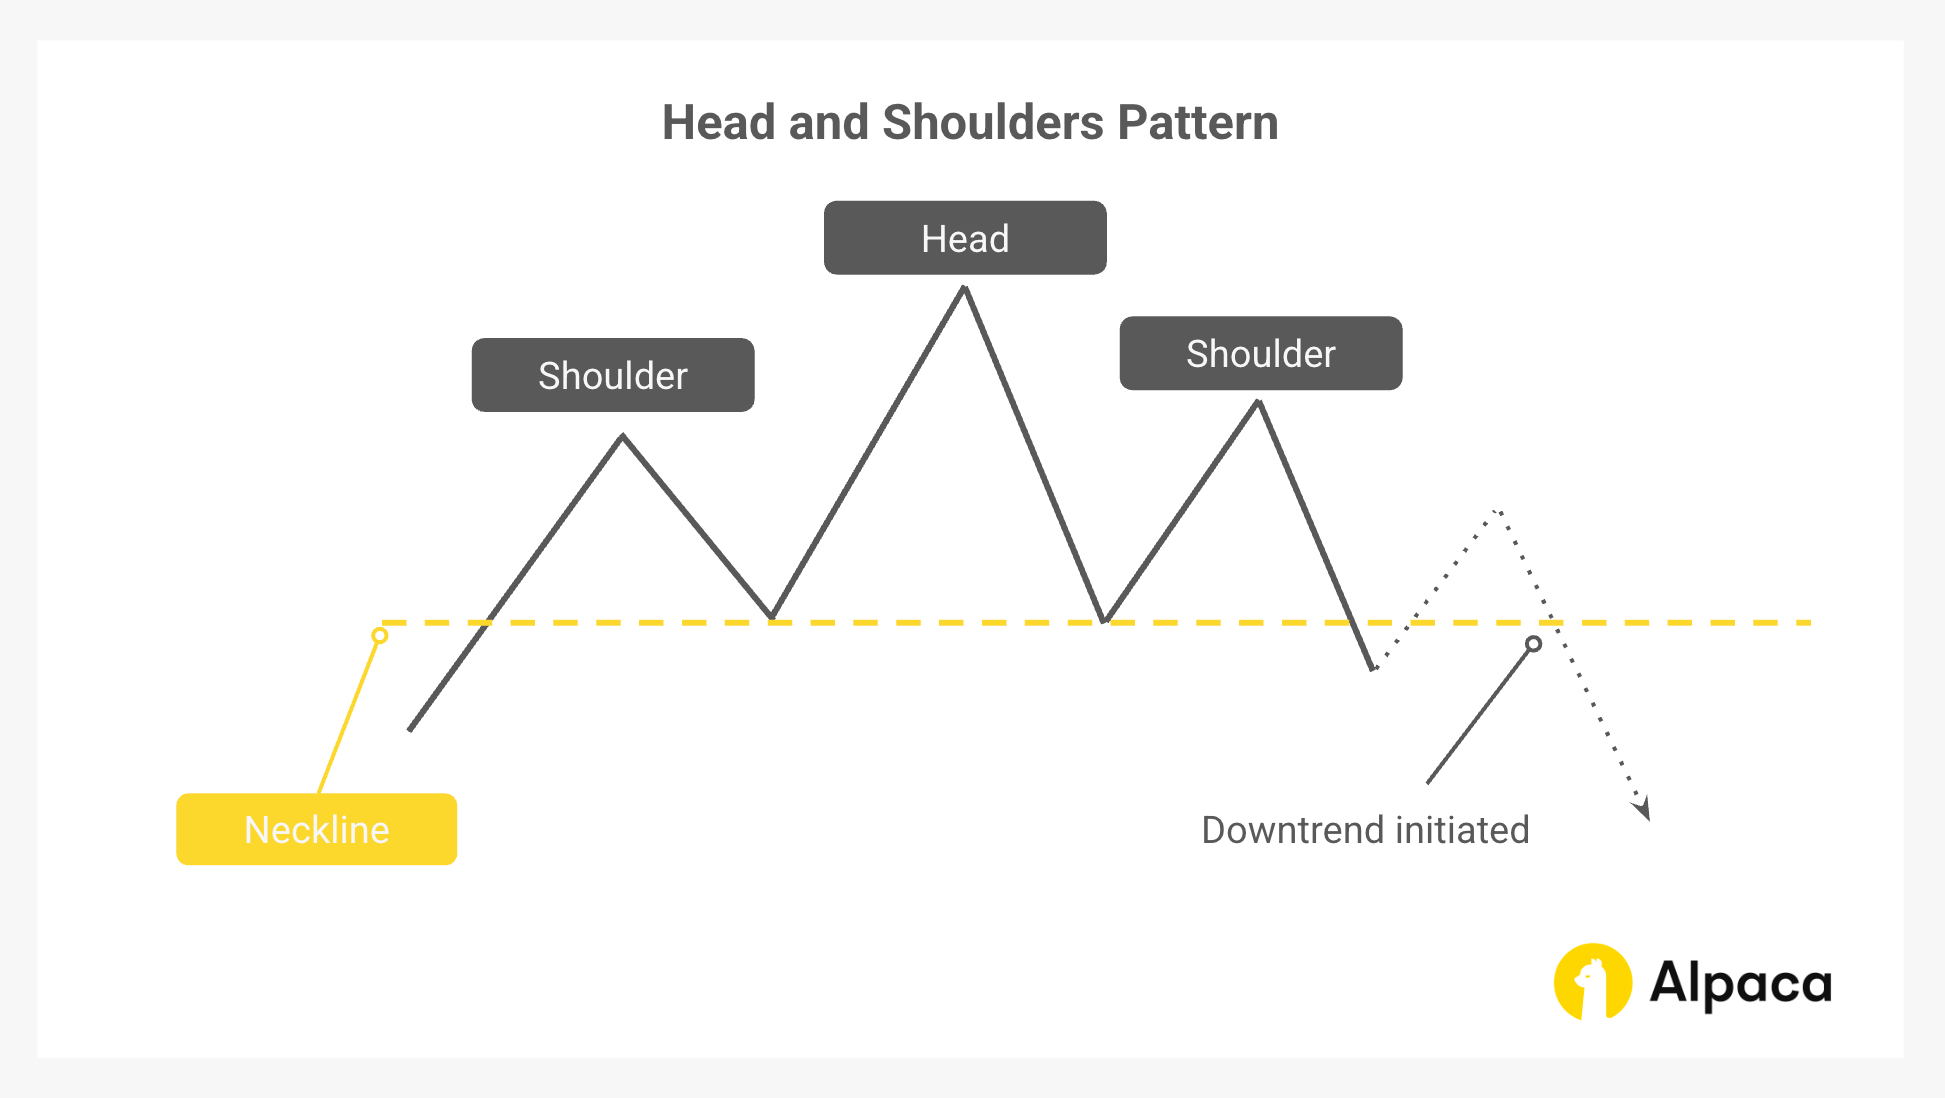
The head and shoulders pattern is a popular chart pattern used in technical analysis that often signals a potential trend reversal. It features three peaks: a central, higher peak (the "head") flanked by two lower peaks (the "shoulders"). Typically forming after an uptrend, it may indicate that bullish momentum is fading, with a possible shift to a downtrend.
What is an Inverse Head and Shoulders Pattern?
The inverse head and shoulders pattern is its opposite, appearing after a downtrend. It includes three troughs, with the middle one (the 'head') being the lowest, suggesting that selling pressure may be weakening, potentially leading to a bullish reversal.
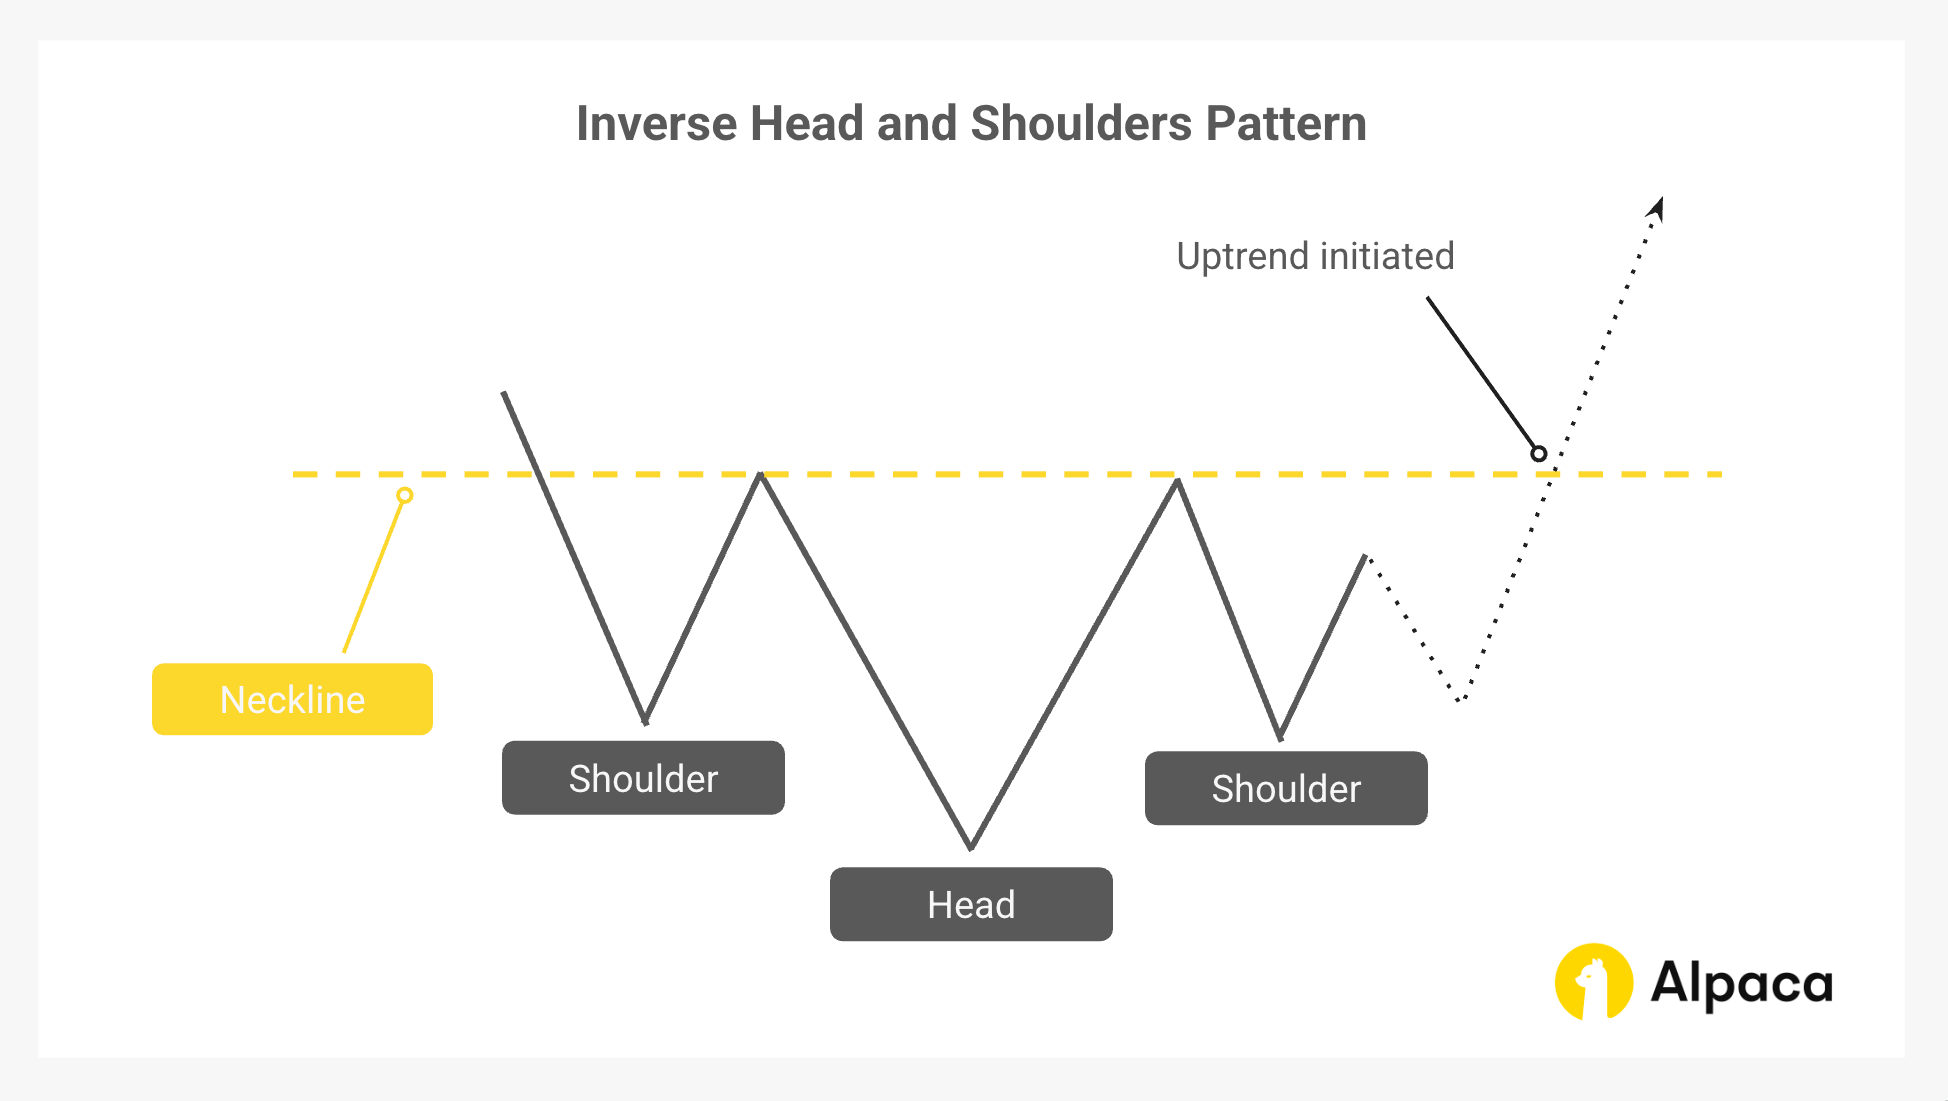
Both patterns include a "neckline" that acts as a key level of support or resistance. A break of this neckline is often viewed as confirmation of a trend reversal.
Understanding the Head and Shoulders Stock Pattern: Target Practice
How the Target Is Estimated
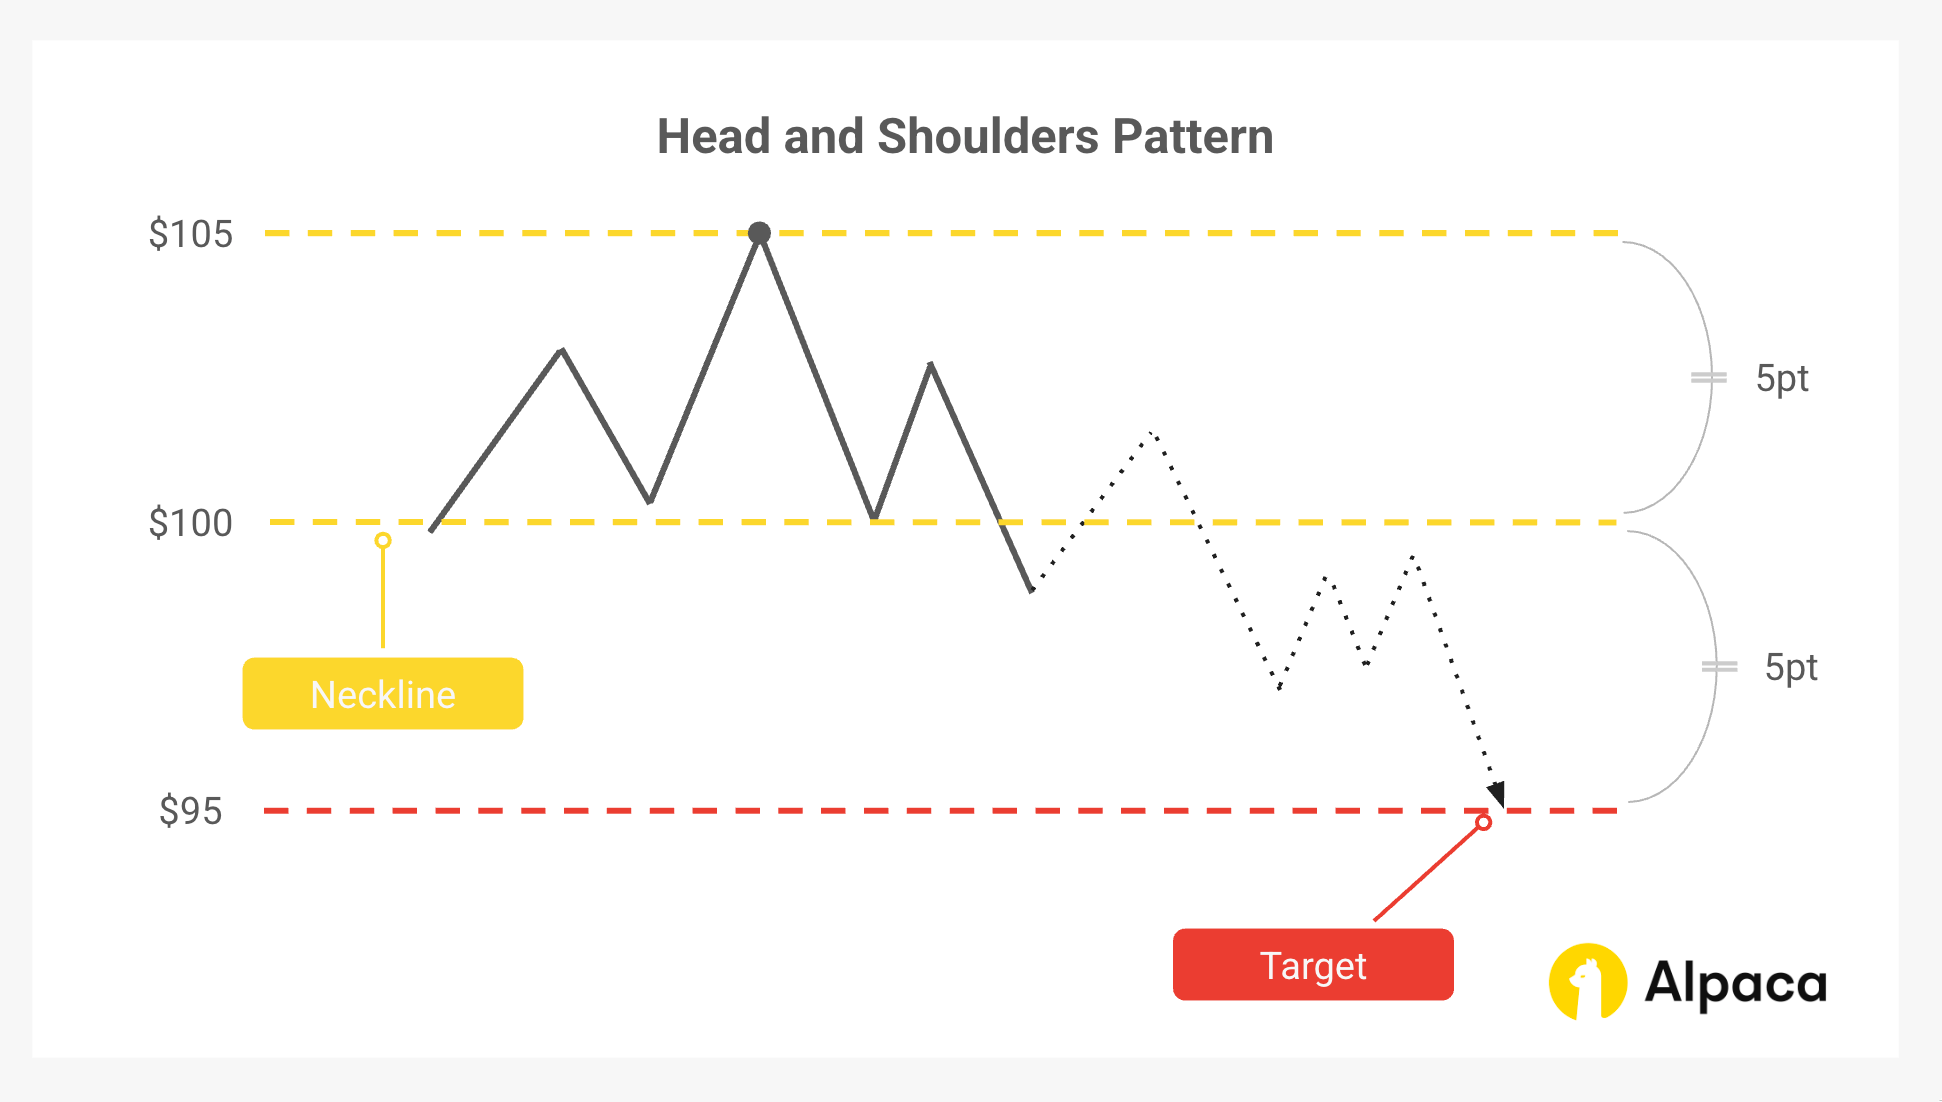
The measured move method is a straightforward way to set a potential price target based on the size of the pattern itself. For both the standard and inverse versions, the process begins by measuring the vertical distance from the top (or bottom) of the head to the neckline.
- In a standard head and shoulders pattern, this distance is measured from the peak of the head down to the neckline.
- In an inverse head and shoulders pattern, it’s measured from the bottom of the head up to the neckline.
Once price breaks through the neckline—either downward or upward—traders often project that same distance from the breakout point to estimate a possible target level.
Example
If the head in a head and shoulders pattern stands $5 above the neckline, and the neckline is at $100, the projected price target might be $95.
Benefits, Pitfalls, and the Importance of Patience on Head and Shoulders Pattern
Like many tools in technical analysis, the head and shoulders pattern offers useful insights but also comes with trade-offs. Understanding both the benefits and the risks can help traders approach this pattern with balanced expectations.
Advantages
- Recognizability: The pattern's distinct structure makes it relatively easy for experienced traders to identify.
- Defined Entry and Exit Points: The neckline provides a clear level for potential entry and stop-loss orders.
- Applicability Across Markets: The pattern can be observed in various financial markets, including stocks, forex, and even some cryptocurrency markets.
Limitations and Risks
- Subjectivity: Identifying the pattern can be somewhat subjective, especially when price movements don't align perfectly with the textbook shape.
- False Breakouts: There is a possibility of false breakouts, where price appears to move beyond the neckline but quickly reverses, resulting in a potential loss.
- Pattern Reliability: While historically followed by reversals, this pattern does not guarantee future performance. It's generally recommended to use it alongside other indicators to help confirm potential trade setups.
Patience Is Key
- In practice, many traders—especially those new to chart patterns—tend to spot head and shoulders formations more often than they actually occur. Taking the time to confirm patterns using factors like trading volume and the context of the preceding trend can make a meaningful difference. With experience, it becomes easier to distinguish genuine setups from lookalikes, helping to reduce the chances of acting on misleading signals.
How to Identify a Head and Shoulders Pattern on TradingView
To effectively trade the head and shoulders pattern, there are a few factors to consider.
Multiple Time Frame Analysis
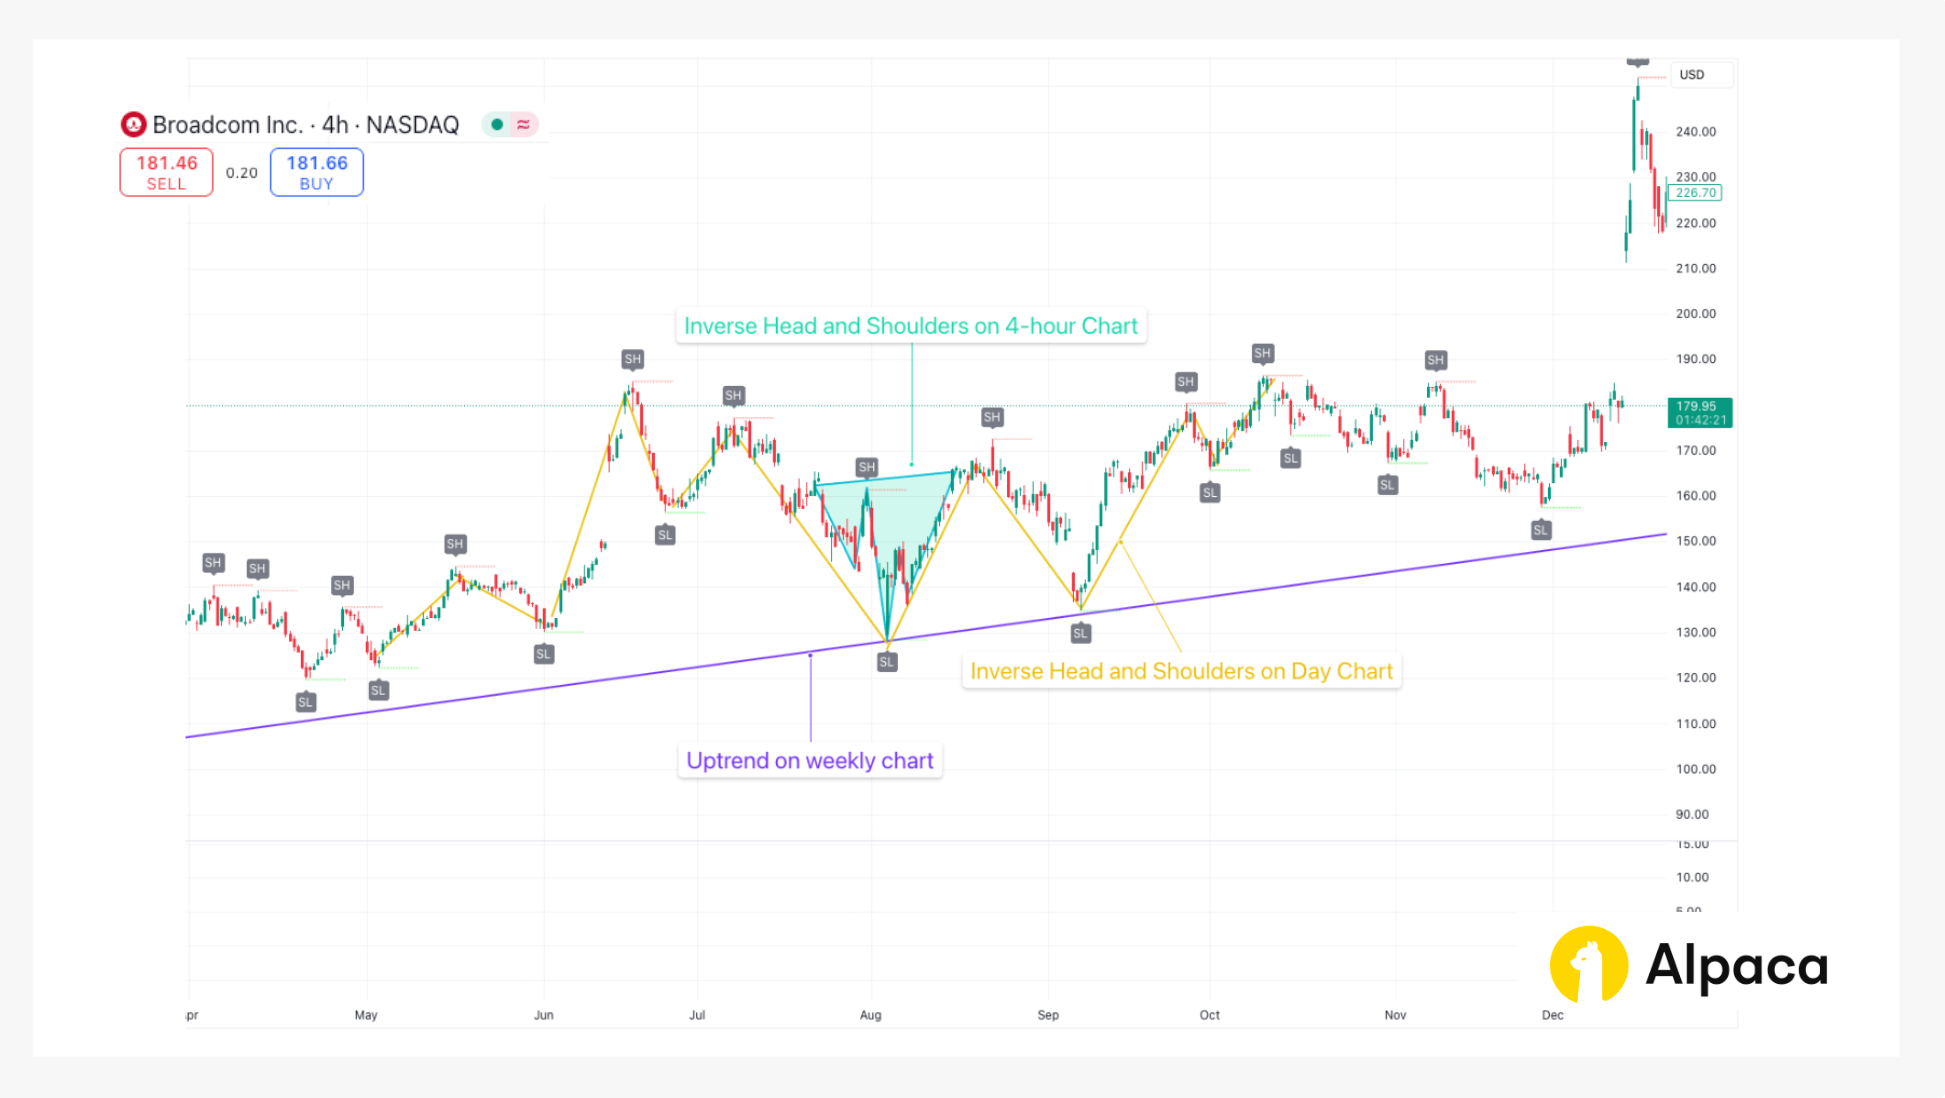
Analyze the chart on different time frames—such as 4-hour, daily, and weekly—to get a complete view of the broader trend. If the weekly chart indicates a downtrend while the 4-hour chart shows an uptrend, it may be premature or risky to interpret price action as a head and shoulders pattern. Aligning trends across time frames generally increases the reliability of your findings.
In the image below, using Broadcom, Inc (AVGO) stock chart, the weekly chart shows a well-established uptrend, indicating bullish market sentiment. On the daily chart, an inverse head and shoulders pattern forms along the upward trend line. The 4-hour chart reveals another inverse head and shoulders setup on a smaller scale. Confirming this bullish structure across multiple time frames may increase a traders’ confidence in a continued uptrend, rather than relying on a single chart interval.
NOTE: "AVGO" is used for demonstration purposes and should not be considered investment advice.
Break of Swing High and Swing Low
Pay attention to recent swing points to confirm the pattern. In a standard head and shoulders formation, a decisive break below the neckline (often aligning with a previous swing low) typically validates the pattern. Conversely, in an inverse head and shoulders, a break above the neckline confirms a bullish reversal. Observing retests of the neckline can further strengthen your confirmation and help refine entry or exit points.
Use of Additional Technical Indicators
Supplement your visual analysis with a few simple indicators to strengthen your signal confirmation and filter out false moves:
- Moving Averages (MA): Use simple or exponential moving averages (such as a 20-day EMA and a 50-day SMA) to gauge overall trend direction. A crossover where the short-term MA moves above the long-term MA supports an uptrend, and vice versa.
- Bollinger Bands: Look at Bollinger Bands to assess volatility and identify overbought or oversold conditions. If the price approaches or breaks out of these bands, it can signal a potential reversal or continuation, adding context to your swing points.
- Moving Average Convergence Divergence (MACD): Monitor the MACD and its histogram to spot momentum shifts. If the MACD lines or histogram diverge from the price action, it might indicate that a breakout is less reliable.
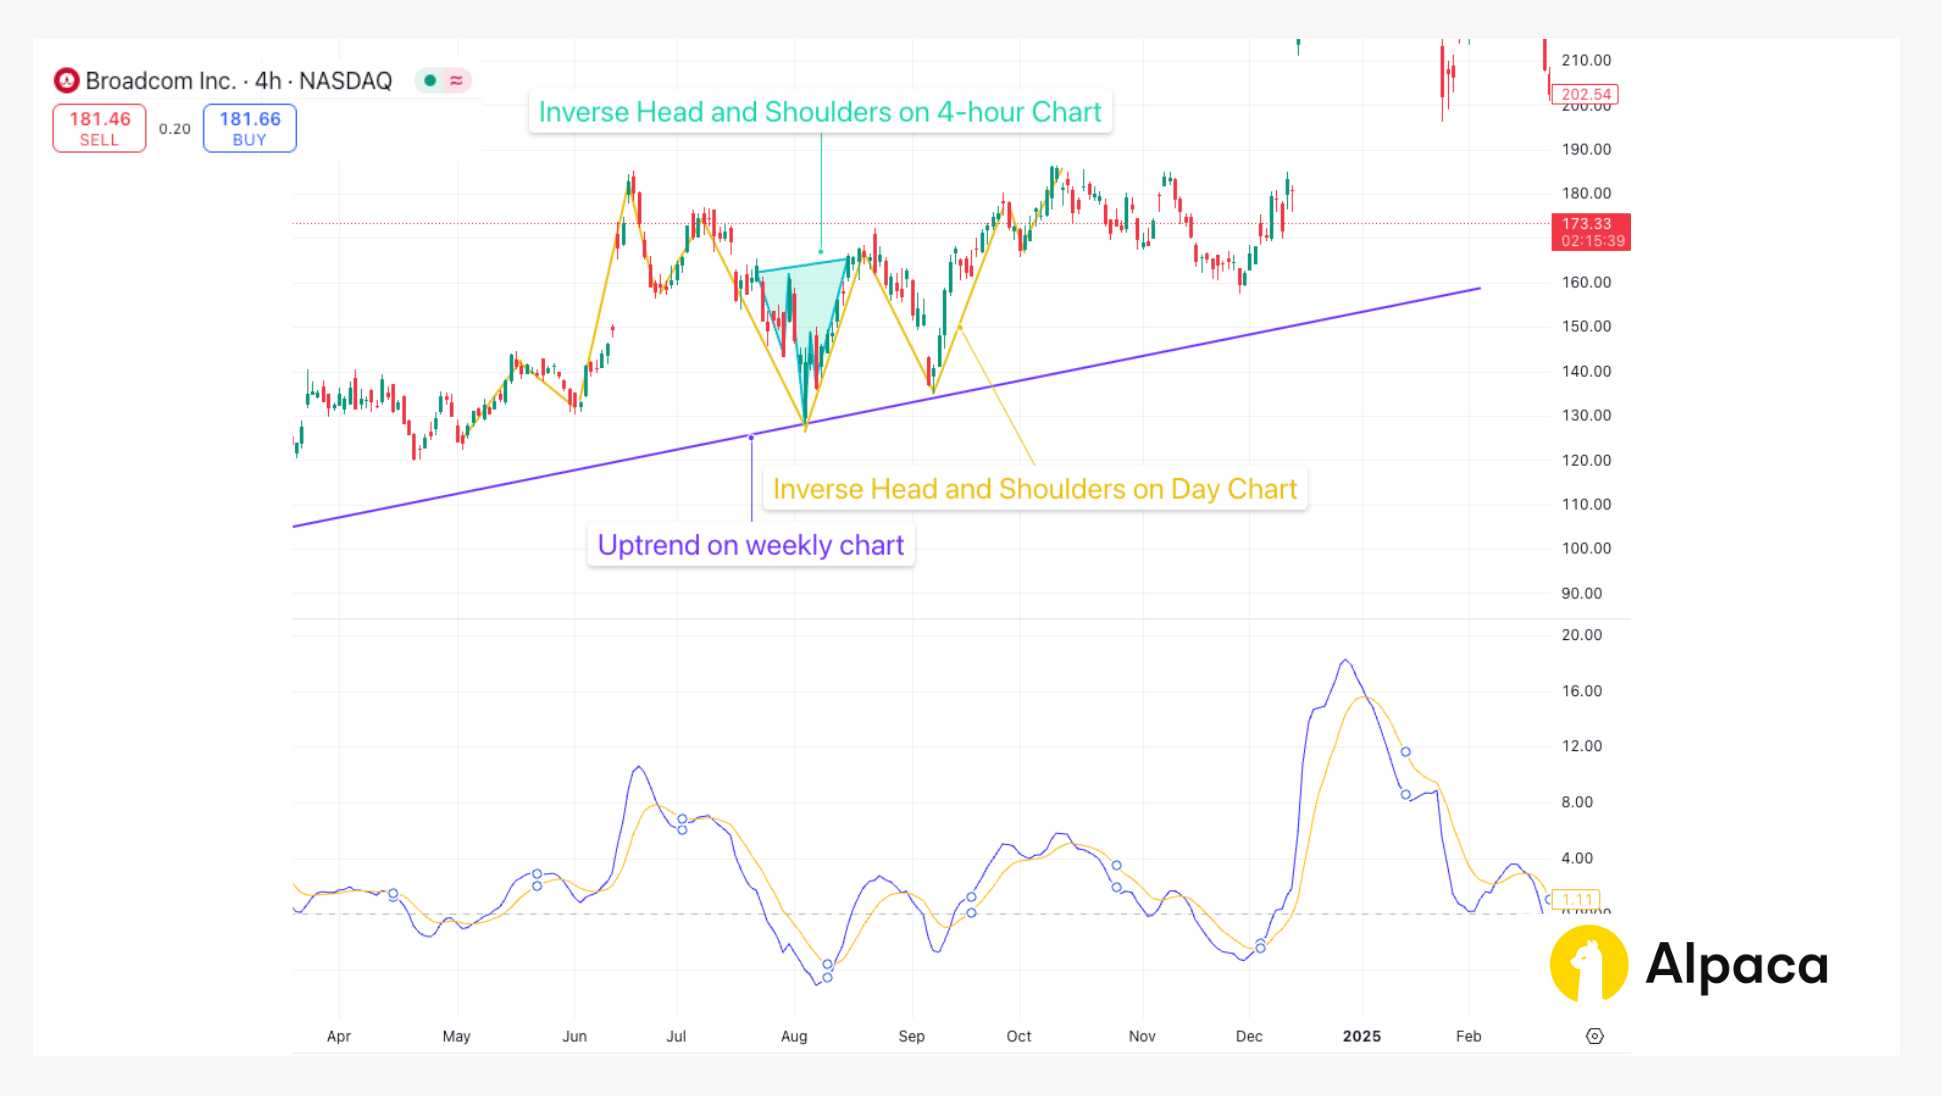
Attached is an image showing the head and shoulders pattern on AVGO stock with the MACD (12,26) displayed below. The MACD enhances the analysis by confirming momentum: a bullish crossover supports the pattern's validity, while divergence—such as flat or declining momentum despite rising prices—warns of a possible false breakout.

TradingView Implementation: Coding the Head and Shoulders Pattern with Pine Script
TradingView is a widely used platform that offers advanced charting tools and a scripting language called Pine Script. The head and shoulders pattern, being a powerful reversal indicator, can be detected automatically using a custom indicator with a Pine Script.
Note: You can also follow the tutorial below by connecting your Alpaca account to your TradingView account. If you don’t have an Alpaca account but have a TradingView account, you can sign up for an Alpaca account now.
Let's explore how to implement this using the example:
Setting Up the Detection System
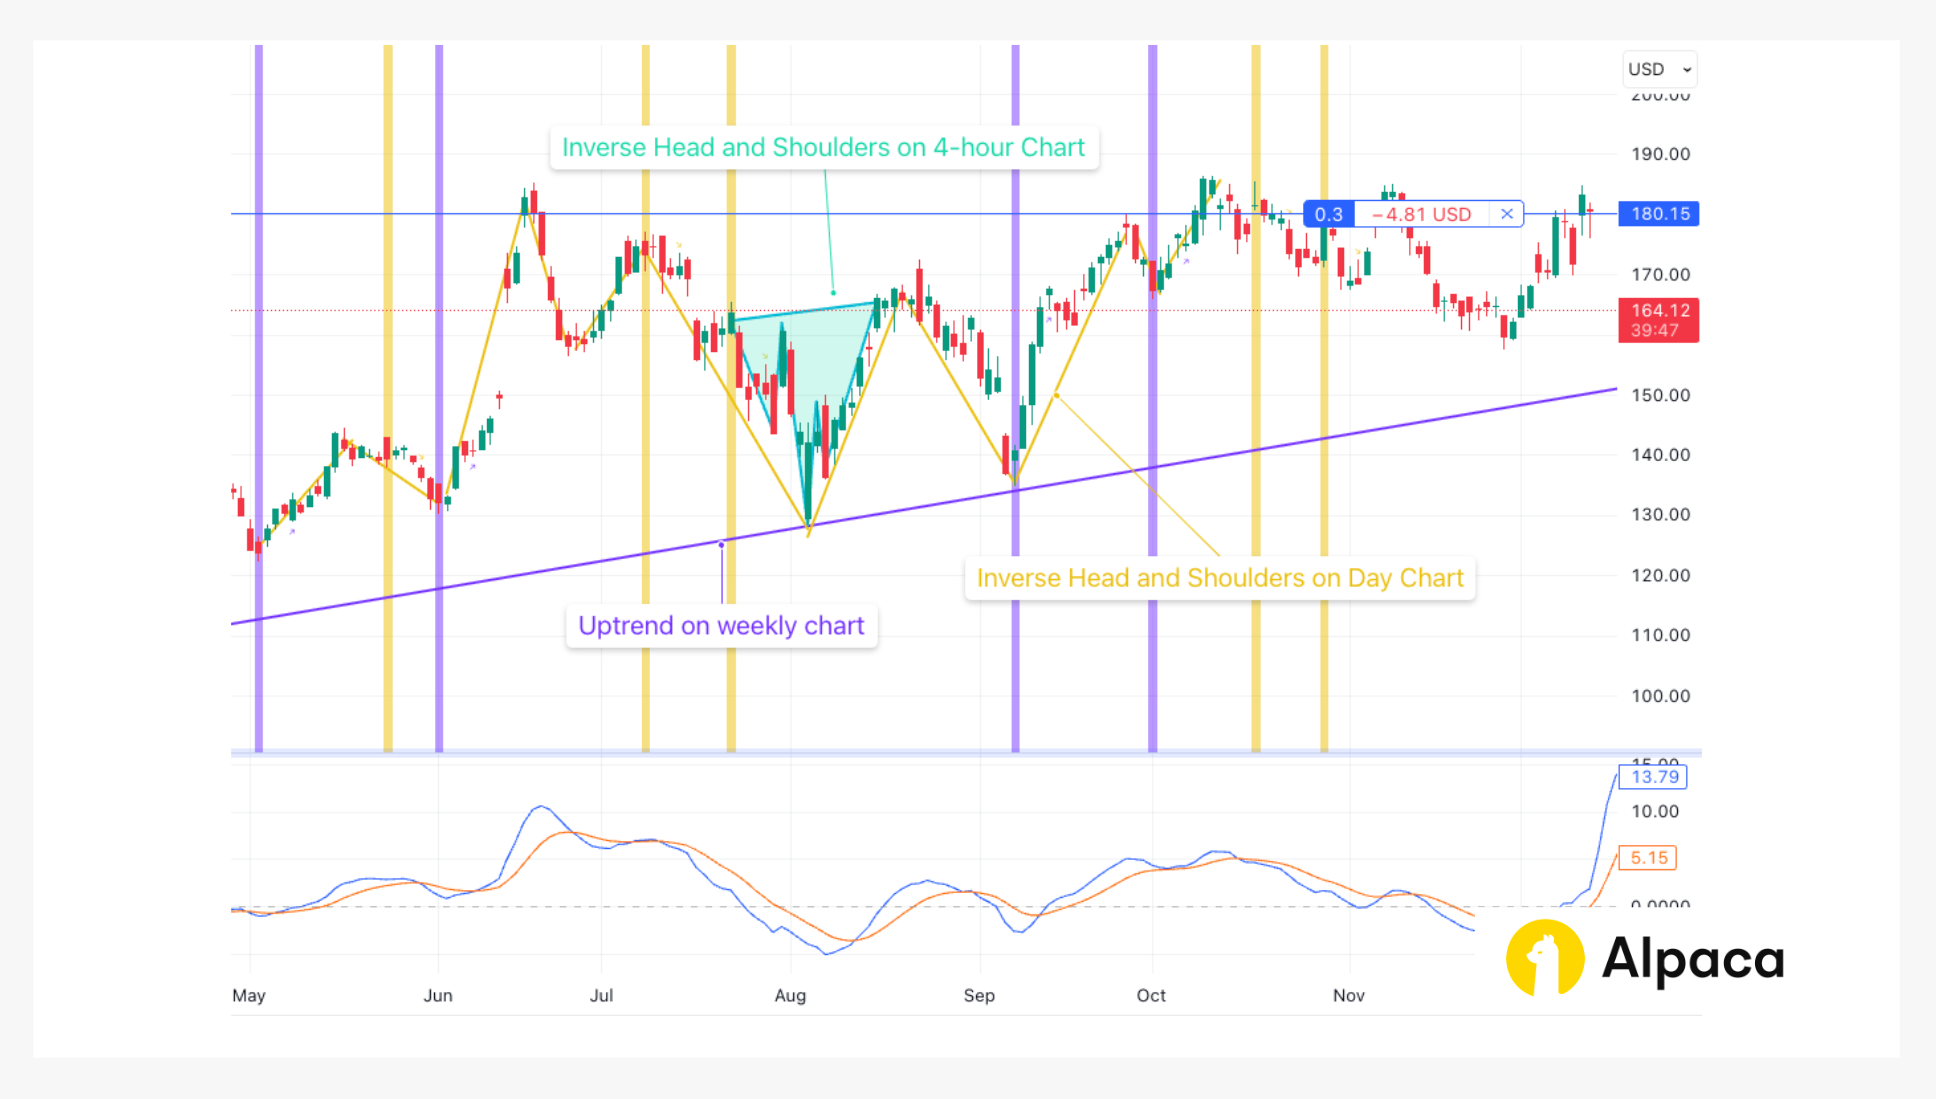
The example Pine Script indicator below automatically highlights both traditional head and shoulders (bearish) and inverse head and shoulders (bullish) patterns on any chart. As shown in the screenshot, the indicator successfully detected inverse head and shoulders patterns on both 4-hour and daily timeframes, coinciding with an uptrend on the weekly chart.
Understanding the Pine Script Code
The script begins by declaring version 6 compatibility and creating an overlay indicator. The leftbars and rightbars parameters allow traders to adjust the sensitivity of the pattern detection—smaller values detect shorter-term patterns while larger values find longer-term formations.
//@version=6
indicator("Head & Shoulders", overlay=true)

// Input parameters
leftbars = input.int(4, title="Left Bars")
rightbars = input.int(4, title="Right Bars")
The core of the detection relies on identifying pivot points—local highs and lows that form the shoulders and head of the pattern.
// Find pivot points
ph = ta.pivothigh(rightbars, leftbars)
pl = ta.pivotlow(rightbars, leftbars)
For the inverse head and shoulders (bullish pattern), the script checks if:
- The right shoulder low is higher than the head low (condi1)
- The head low is lower than the left shoulder low (condi2)
When both conditions are met, a purple background highlights the pattern.
// Bullish (Inverse) Head and Shoulders pattern detection
condi1 = ta.valuewhen(na(pl) == false, pl, 0) > ta.valuewhen(na(pl[1]) == false, pl[1], 0) ? 1 : 0
condi2 = ta.valuewhen(na(pl[1]) == false, pl[1], 0) < ta.valuewhen(na(pl[2]) == false, pl[2], 2) ? 1 : 0
colorbull = condi1 == 1 and condi2 == 1
Similarly, for the traditional head and shoulders (bearish pattern), the script verifies if:
- The right shoulder high is lower than the head high (condi3)
- The head high is higher than the left shoulder high (condi4)
When detected, a gold background highlights this bearish pattern.
// Bearish Head and Shoulders pattern detection
condi3 = ta.valuewhen(na(ph) == false, ph, 0) < ta.valuewhen(na(ph[1]) == false, ph[1], 0) ? 1 : 0
condi4 = ta.valuewhen(na(ph[1]) == false, ph[1], 0) > ta.valuewhen(na(ph[2]) == false, ph[2], 2) ? 1 : 0
colorbear = condi3 == 1 and condi4 == 1
Visual Indicators and Alerts
The indicator uses distinct visual cues:
- Purple background (#7331FF) with an upward arrow (↗) for bullish patterns
- Gold background (#EBC003) with a downward arrow (↘) for bearish patterns
These visual markers make it easy to spot patterns across multiple timeframes, as demonstrated in the screenshot where inverse head and shoulders patterns appear on both 4-hour and daily charts.
// Background colors for pattern visualization
bgcolor(colorbull ? color.new(#7331FF, 50) : na, title="Bullish H&S", offset=-leftbars)
bgcolor(colorbear ? color.new(#EBC003, 50) : na, title="Bearish H&S", offset=-leftbars)

// Alert signals
plotchar(colorbull, title="Bullish H&S", char="↗", location=location.belowbar, color=color.new(#7331FF, 0))
plotchar(colorbear, title="Bearish H&S", char="↘", location=location.abovebar, color=color.new(#EBC003, 0))
Setting Up Trading Alerts
The script includes three alert conditions that can notify traders when:
- A bullish (inverse) head and shoulders forms
- A bearish head and shoulders forms
- Either pattern appears
This allows traders to receive timely notifications without constant chart monitoring.
As seen in the screenshot above, this indicator successfully highlighted multiple inverse head and shoulders patterns that aligned with a broader uptrend, demonstrating its effectiveness as a trend confirmation tool when used across multiple timeframes.
// Alert conditions
alertcondition(colorbull, title="Bullish H&S Detected", message="Bullish Head and Shoulders Pattern Detected")
alertcondition(colorbear, title="Bearish H&S Detected", message="Bearish Head and Shoulders Pattern Detected")
alertcondition(colorbear or colorbull, title="H&S Signal", message="Head and Shoulders Pattern Detected")
How to Trade Based on Head and Shoulders Patterns using Alpaca on TradingView
After you identify a head and shoulders pattern or an inverse head and shoulders pattern and predict the trend, you can trade the asset using Alpaca's trading integration on TradingView.
For those looking to integrate trading with Alpaca’s Trading API, here are some additional resources:
- Sign up for an Alpaca Trading API account
- How to Connect to Alpaca's Trading API
- How to Start Paper Trading with Alpaca's Trading API
- How to Build a Free RSI and MACD Trading Bot with ChatGPT and Alpaca
Note:
- If you open multiple charts on different tabs, TradingView detects it and may detach the integration.
- If you have any questions or issues regarding Alpaca's integration on TradingView, please reach out to our customer support. We also appreciate it if you could share your feedback and experiences on our forum, Slack community, or subreddit!
Conclusion
The head and shoulders pattern is a fundamental tool in technical analysis, offering insights into potential trend reversals. By understanding its structure, variations, and the context in which it appears, traders can make more informed decisions.
While the pattern often provides valuable signals, it's essential to consider its limitations and corroborate findings with additional technical indicators and thorough analysis. Combining theoretical knowledge with practical application on platforms like TradingView and Alpaca can enhance one's trading strategy and execution.
Alpaca and TradingView are not affiliated and neither are responsible for the liabilities of the other.
All investments involve risk, and the past performance of a security, or financial product does not guarantee future results or returns. There is no guarantee that any investment strategy will achieve its objectives. Please note that diversification does not ensure a profit, or protect against loss. There is always the potential of losing money when you invest in securities, or other financial products. Investors should consider their investment objectives and risks carefully before investing.
Securities brokerage services are provided by Alpaca Securities LLC ("Alpaca Securities"), member FINRA/SIPC, a wholly-owned subsidiary of AlpacaDB, Inc. Technology and services are offered by AlpacaDB, Inc.
Cryptocurrency services are made available by Alpaca Crypto LLC ("Alpaca Crypto"), a FinCEN registered money services business (NMLS # 2160858), and a wholly-owned subsidiary of AlpacaDB, Inc. Alpaca Crypto is not a member of SIPC or FINRA. Cryptocurrencies are not stocks and your cryptocurrency investments are not protected by either FDIC or SIPC. Please see the Disclosure Library for more information.
Cryptocurrency is highly speculative in nature, involves a high degree of risks, such as volatile market price swings, market manipulation, flash crashes, and cybersecurity risks. Cryptocurrency regulations are continuously evolving, and it is your responsibility to understand and abide by them. Cryptocurrency trading can lead to large, immediate and permanent loss of financial value. You should have appropriate knowledge and experience before engaging in cryptocurrency trading. For additional information, please click here.
This is not an offer, solicitation of an offer, or advice to buy or sell securities or cryptocurrencies or open a brokerage account or cryptocurrency account in any jurisdiction where Alpaca Securities or Alpaca Crypto, respectively, are not registered or licensed, as applicable.
The content of this tutorial is for general informational purposes only. All examples are for illustrative purposes only.
Past hypothetical backtest results do not guarantee future returns, and actual results may vary from the analysis.
Please note that this article is for general informational purposes only and is believed to be accurate as of the posting date but may be subject to change. The examples above are for illustrative purposes only.
The Paper Trading API is offered by AlpacaDB, Inc. and does not require real money or permit a user to transact in real securities in the market. Providing use of the Paper Trading API is not an offer or solicitation to buy or sell securities, securities derivative or futures products of any kind, or any type of trading or investment advice, recommendation or strategy, given or in any manner endorsed by AlpacaDB, Inc. or any AlpacaDB, Inc. affiliate and the information made available through the Paper Trading API is not an offer or solicitation of any kind in any jurisdiction where AlpacaDB, Inc. or any AlpacaDB, Inc. affiliate (collectively, “Alpaca”) is not authorized to do business.