
Please note that this article is for educational and informational purposes only All screenshots are for illustrative purposes only. The views and opinions expressed are those of the author and do not reflect or represent the views and opinions of Alpaca. Alpaca does not recommend any specific securities or investment strategies.
Technical indicators are part of the many available tools used by traders to aid decision-making in technical analysis. Good technical indicators aim to return a maximum amount of actionable information while remaining easy to interpret and interact with. Fairly basic indicators such as moving averages, momentum oscillator, and RSI might fail to achieve this task, encouraging traders to pair them with other indicators, ultimately increasing information at the cost of ease of interpretation and ease of interaction.
In this post, a new simple technical indicator (Andean Oscillator) aiming to identify the direction as well as the degree of variations of trends in a security is proposed. This indicator is based on an online algorithm and can be suitable for high-frequency trading. Codes for the indicator are shared in both python, as well as pinescript for users wishing to use the indicator directly on TradingView. Graphics are obtained using Python and the Alpaca Market Data API.
Disclaimer: The indicator as well as its interpretation showcased in this post does not guarantee profitable results. All the contents in this post are for educational purposes only.
Calculation Overview
The Andean oscillator calculation is based on two steps:
- Estimate price upper/lower extremities.
- Determine the degree of variation of each extremity.
Each of these steps is described in the sub-sections below.
If you are not interested in how the indicator is calculated you can directly switch to the “Usage” section below.
Estimating Price Extremities Using Exponential Envelopes

Exponential envelopes can be described as a trend indicator consisting of one upper and one lower extremity, and as such is similar in practice to indicators such as Bollinger Bands, Keltner Channels, Moving Average Envelopes...etc. These envelopes share some characteristics with the exponential moving average and make use of exponential averaging for their calculations, hence their name.
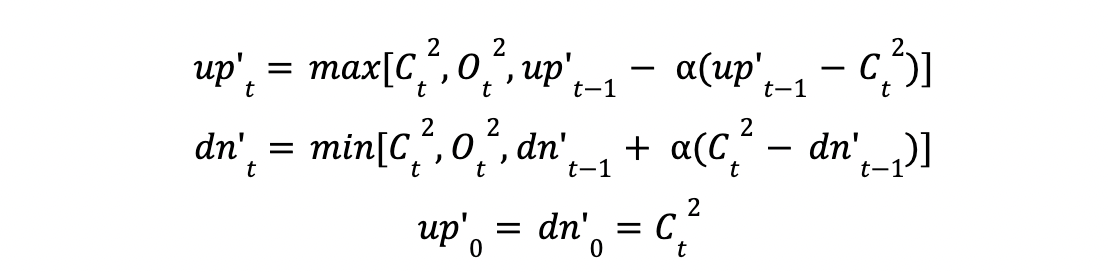
Let C_t and O_t respectively denote the closing and opening price at time t. Each extremity calculation with user setting length is given as follows:

with:

Where up_t is the upper extremity, dn_t the lower extremity, and the convergence factor controlling how fast the extremities converges toward the price, with higher length values returning a slower convergence factor. Here the opening price is also used due to the occurrence of price gaps.
In this section, we will apply exponential envelopes to a simple random walk generated using numpy.
import numpy as np

prices = np.random.normal(size=100).cumsum()
The main advantage of exponential envelopes is that they are based on an efficient online algorithm, that is they are computed in a serial fashion feeding on one input at a time, and as such do not need to memorize precedent inputs.
It is possible to identify market trends using both extremities, with an uptrend being detected once the price is equal to the upper extremity, and a downtrend once the price is equal to the lower extremity.
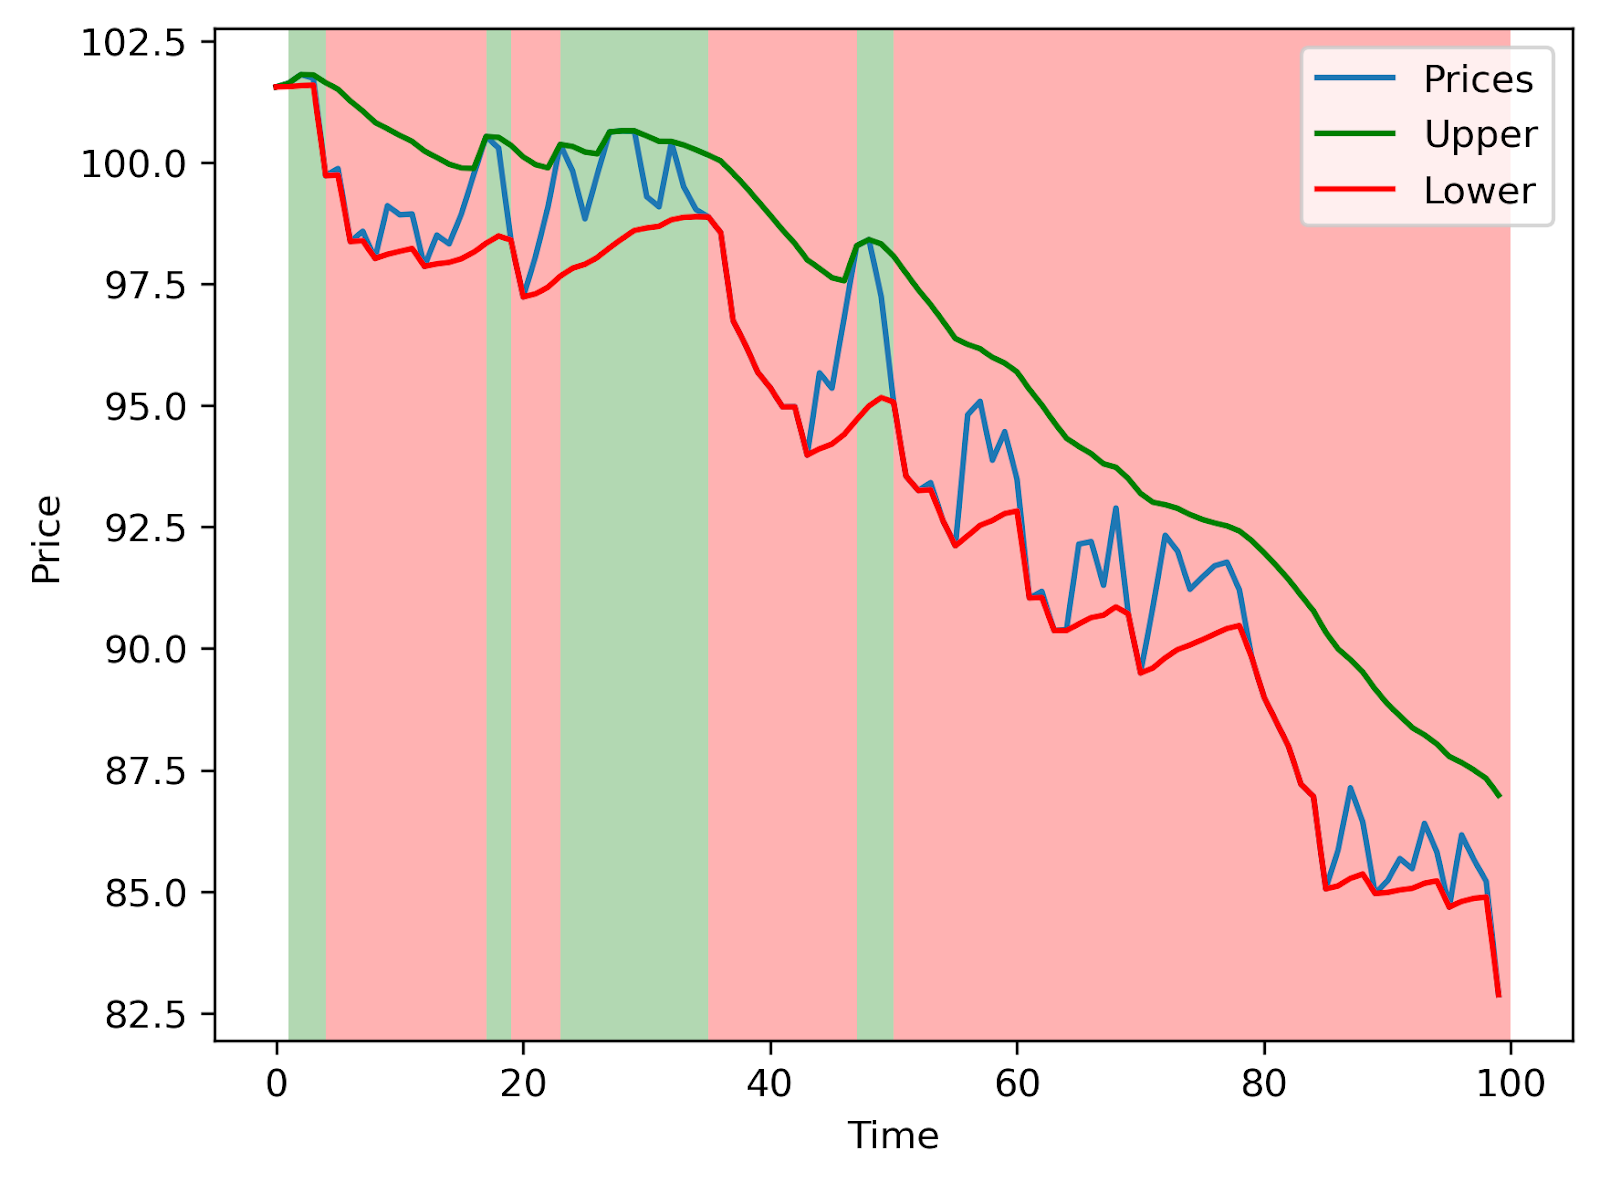
A higher degree of variations of the upper extremity would reflect prices moving upward while a higher degree of variations of the lower extremity would reflect prices moving downward.
Determining The Extremities Degree Of Variations
We now want to obtain a smooth estimate of the degree of variation of each extremity while keeping a maximum reactivity.
Applying a rolling standard deviation to each extremity can be an option, but we would suffer from a lower reactivity. We can however obtain a direct estimate using the same concept used for the naive computation of variance:

Which for the rolling standard deviation of the closing price σ_t with period length translates to:
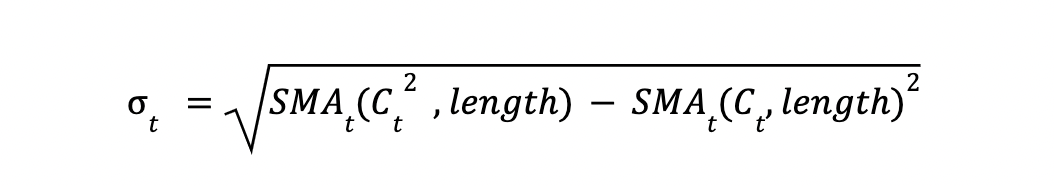
Where SMA_t(C_t, length) denotes a simple moving average of the closing price with period length. This estimate is used in certain trading platforms.
We can use this for our indicator by introducing two additional extremities whose calculations are based on the squared closing and opening price.
Andean Oscillator Calculation
The proposed indicator possesses a main setting length and an additional one length'.
Our indicator is made of three components, one bullish component reflecting upward price variations, one bearish component reflecting downward price variations, and one signal line based on the length' setting with multiple purposes detailed in the following “Usage” section.
Each one of these components is calculated as follows:

with
Where EMA denotes an exponential moving average. The calculations for up_t, dn_t, and are given in the exponential envelopes section.
Usage
The Andean Oscillator can return multiple information to the user. Its core interpretation is given by the bull and bear components.
A rising bull component indicates the presence of bullish price variations while a rising bear component indicates the presence of bearish price variations.
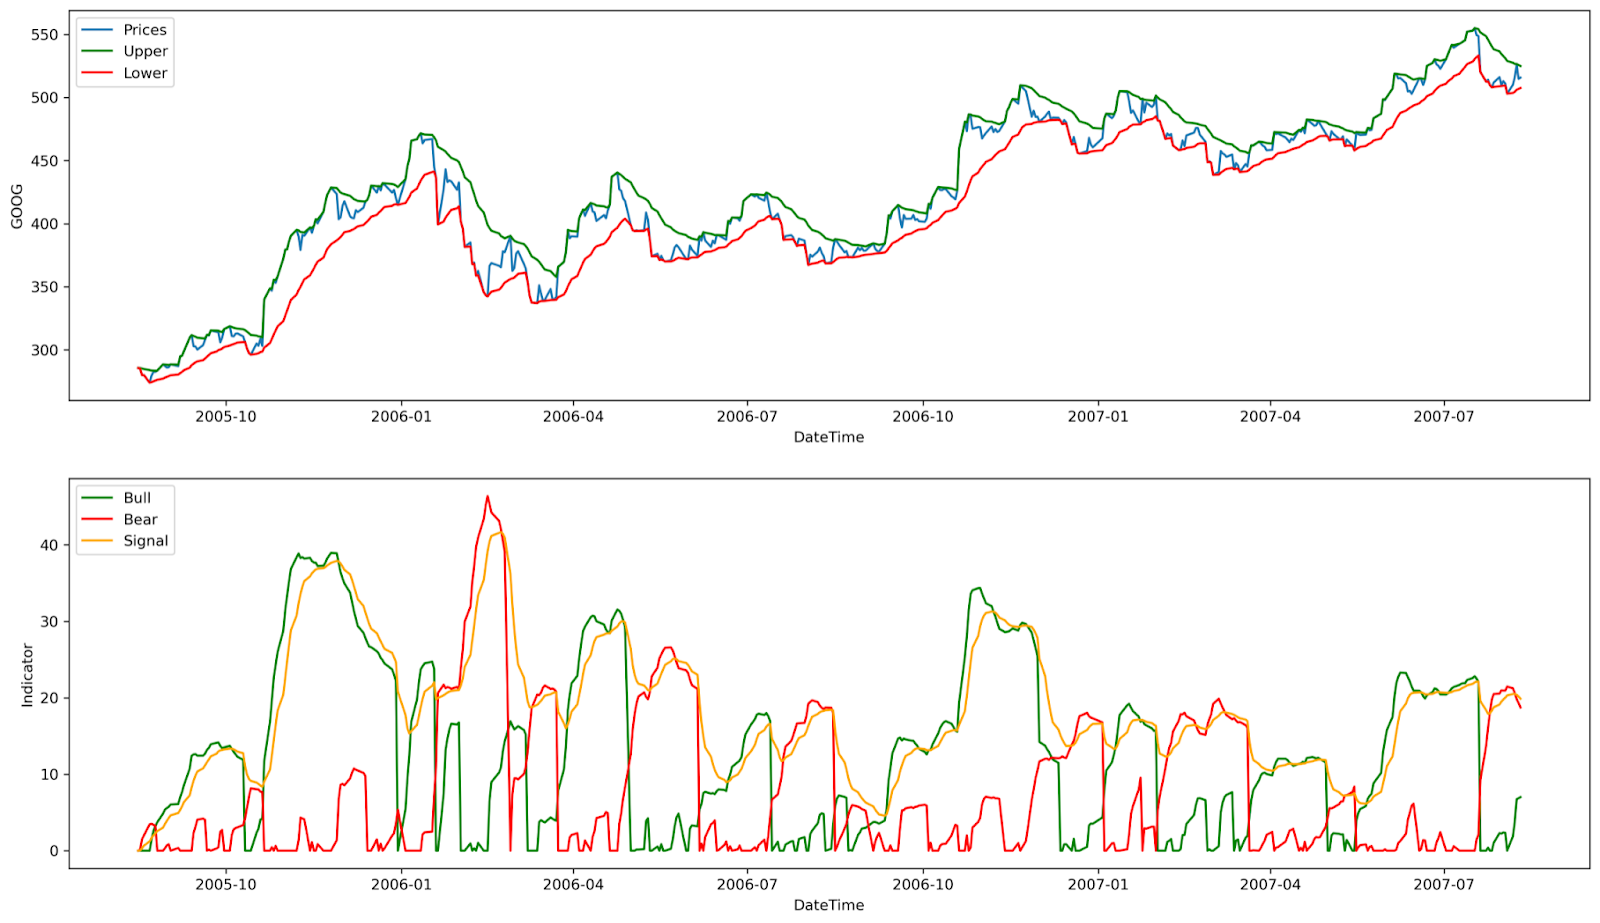
When the bull component is over the bear component market is up-trending, and the user can expect new higher highs. When the bear component is over the bull component market is down-trending, and the user can expect new lower lows. Such a trend identification rule reflects the one described in the exponential envelopes section. This can be seen in the image below.
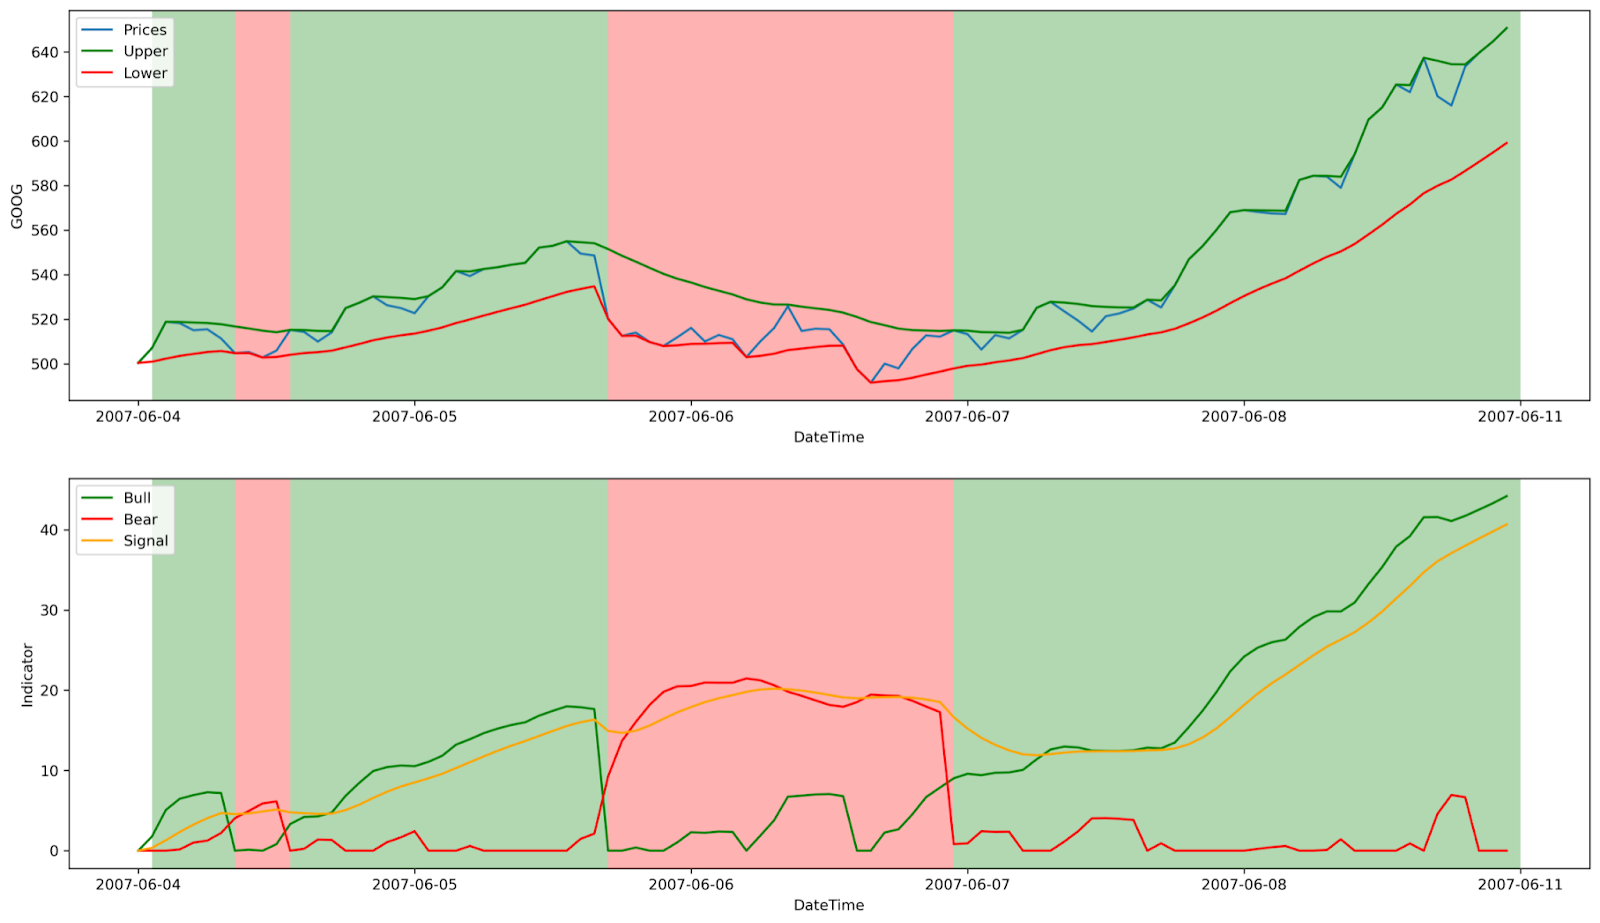
Notice how the bull and bear components form what looks like a mountain range, this characteristic is what inspired the name of the indicator, with Andean referring to the Andes, the habitat of Alpacas.
Signal Line
The signal line allows a more developed interpretation of the indicator and can be used in several ways.
It is possible to use it to filter out potential false signals given by the crosses between the bullish and bearish components. As such the user might want to enter a position once the bullish or bearish component crosses over the signal line instead.
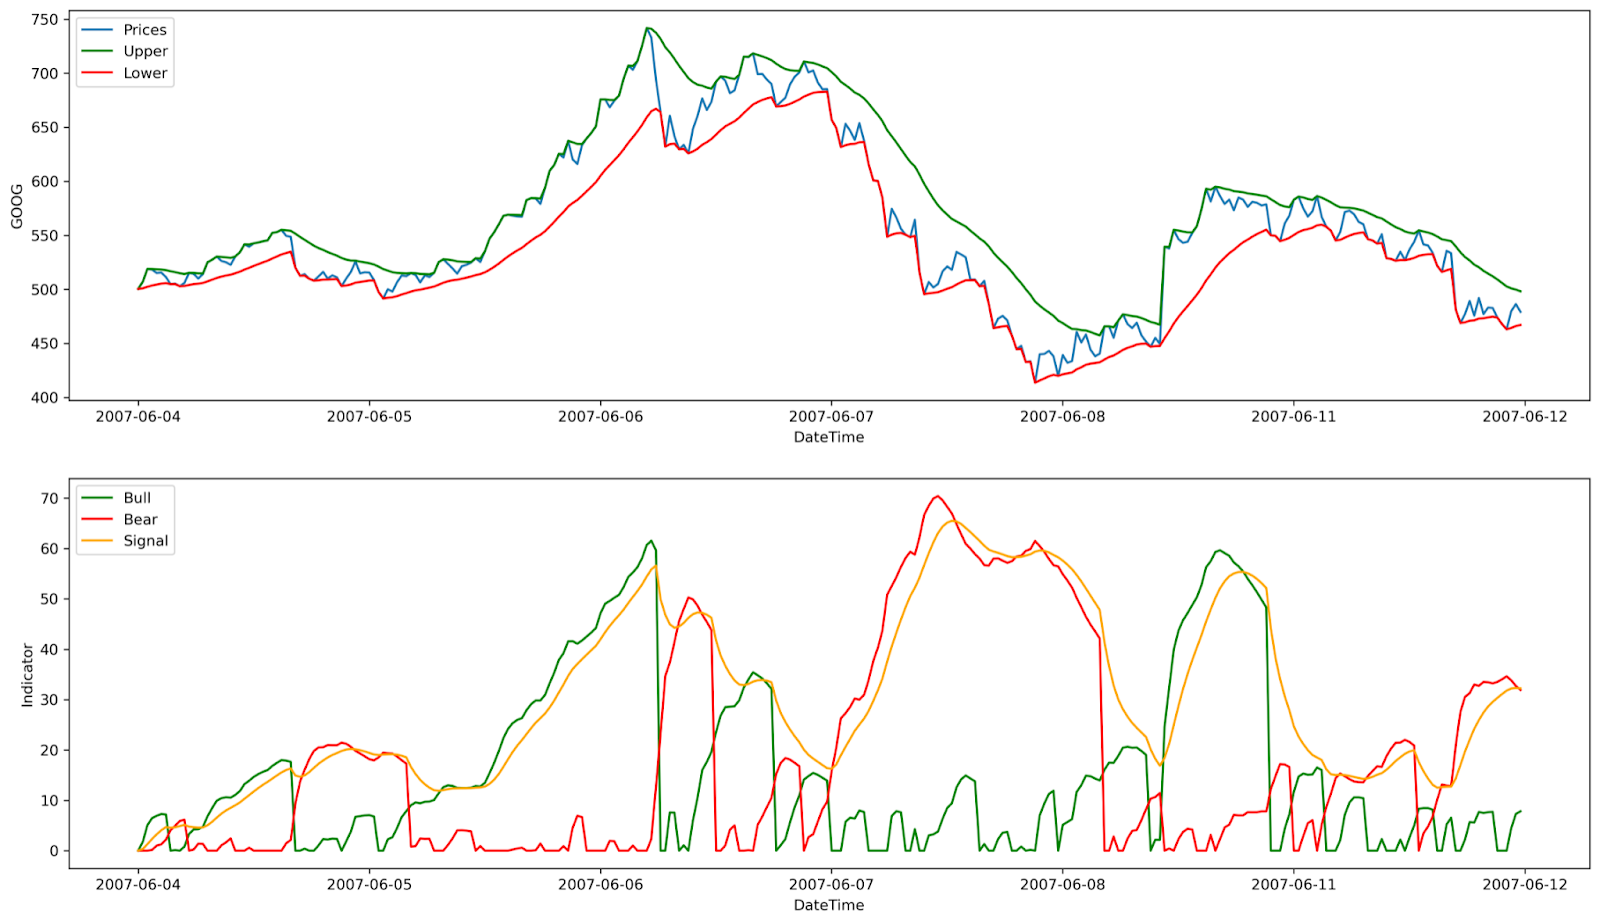
In the image above we can see how waiting for the bullish/bearish components to cross the signal line (in orange) allows filtering crosses between the bullish/bearish that would have ended in a loss.
When the dominating component is declining it generally means that the current trend is losing strength, indicating the presence of a retracement or a potential reversal. A dominant component crossing under the signal line can be used to more easily indicate that the current trend is losing strength.
Rules For Trend Trading
Users wanting to use the indicator to perform backtests or paper trading can use the following trading rules:
- Long : bullish component cross over bearish component
- Short : bearish component cross over bullish component
- Exit Long : bullish component cross under signal line
- Exit Short : bearish component cross under signal line
Exits rules are optional.
A filter for false signals can be introduced by using the following long/short conditions instead:
- Long : bullish component cross over signal line once per detected trend
- Short : bearish component cross over signal line once per detected trend
Note that while this might prevent trading certain false signals it will induce a worse timing compared to the first proposed long/short conditions.
The OHLC market data necessary to backtest these rules can be obtained through the bars endpoint of the Alpaca market data API while paper trading can be performed using the Alpaca orders API.
Conclusion
In this post a new technical indicator used to estimate the direction as well as the degree of variations of trends in a security has been proposed, and trading rules based on the indicator have been showcased.
It is important to note that the usages of the Andean Oscillator are not limited to the one showcased in this post, users are free to experiment and find other possible interpretations.
Due to the usage of exponential envelopes for its calculation, it is possible to improve the proposed indicator. One option would be to introduce a time-varying convergence factor such that the indicator can adapt to various market characteristics, such as volatility, volume...etc.
If you have any suggestions hit me up on Twitter or TradingView.
About The Author
Alex Pierrefeu is a programmer specialized in the development of trading tools and is currently the lead developer of the largest technical indicator vendor company LuxAlgo.
Twitter : @alexgrover14
Tradingview : alexgrover
Github : alexgrover
Codes
Python
import numpy as np

'''
Inputs
------
close : Closing price (Array)
open  : Opening price (Array)

Settings
--------
length        : Indicator period (float)
signal_length : Signal line period (float)

Returns
-------
Bull   : Bullish component (Array)
Bear   : Bearish component (Array)
Signal : Signal line (Array)

Example
-------
bull,bear,signal = AndeanOsc(close,open,14,9)
'''

def AndeanOsc(close,open,length,signal_length):
    N = len(close)

    alpha = 2/(length+1)
    alpha_signal = 2/(signal_length+1)

    up1,up2,dn1,dn2,bull,bear,signal = np.zeros((7,N))

    up1[0] = dn1[0] = signal[0] = close[0]
    up2[0] = dn2[0] = close[0]**2

    for i in range(1,N):
        up1[i] = max(close[i],open[i],up1[i-1] - alpha*(up1[i-1] - close[i]))
        dn1[i] = min(close[i],open[i],dn1[i-1] + alpha*(close[i] - dn1[i-1]))

        up2[i] = max(close[i]**2,open[i]**2,up2[i-1] - alpha*(up2[i-1] - close[i]**2))
        dn2[i] = min(close[i]**2,open[i]**2,dn2[i-1] + alpha*(close[i]**2 - dn2[i-1]))

        bull[i] = np.sqrt(dn2[i] - dn1[i]**2)
        bear[i] = np.sqrt(up2[i] - up1[i]**2)

        signal[i] = signal[i-1] + alpha_signal*(np.maximum(bull[i], bear[i]) - signal[i-1])

    return bull,bear,signal
Pinescript
//@version=5
indicator("Andean Oscillator")
//Settings
length     = input(50)
sig_length = input(9,'Signal Length')

//Exponential Envelopes
var alpha = 2/(length+1)
var up1 = 0.,var up2 = 0.
var dn1 = 0.,var dn2 = 0.
C = close
O = open

up1 := nz(math.max(C,O,up1[1] - (up1[1]-C)*alpha),C)
up2 := nz(math.max(C*C,O*O,up2[1] - (up2[1]-C*C)*alpha),C*C)

dn1 := nz(math.min(C,O,dn1[1] + (C-dn1[1])*alpha),C)
dn2 := nz(math.min(C*C,O*O,dn2[1] + (C*C-dn2[1])*alpha),C*C)

//Components
bull = math.sqrt(dn2-dn1*dn1)
bear = math.sqrt(up2-up1*up1)
signal = ta.ema(math.max(bull,bear),sig_length)

//Plots
plot(bull,'Bullish Component',#0cb51a)
plot(bear,'Bearish Component',#ff1100)
plot(signal,'Signal',#ff5d00)
Alpaca does not prepare, edit, or endorse Third Party Content. Alpaca does not guarantee the accuracy, timeliness, completeness or usefulness of Third Party Content, and is not responsible or liable for any content, advertising, products, or other materials on or available from third party sites.
Brokerage services are provided by Alpaca Securities LLC ("Alpaca"), member FINRA/SIPC, a wholly-owned subsidiary of AlpacaDB, Inc. Technology and services are offered by AlpacaDB, Inc.
This is not an offer, solicitation of an offer, or advice to buy or sell securities, or open a brokerage account in any jurisdiction where Alpaca is not registered (Alpaca is registered only in the United States).