The Moving Average Convergence Divergence (MACD) indicator is a commonly used momentum tool in quantitative trading. According to StockCharts' ChartSchool¹, MACD was developed by Gerald Appel in the late 1970s and uses exponential moving averages (EMAs) to track shifts in price momentum. Some traders use MACD crossover signals as part of rule-based systems that generate entry and exit conditions for equities, ETFs, and other instruments.
This guide covers how to calculate MACD components in Python, detect crossover events programmatically, and submit orders using Alpaca's Trading API². All examples use Alpaca's paper trading³ environment and are strictly educational.
Key Takeaways
- MACD is a lagging, trend-following momentum indicator calculated from the difference between a 12-period and 26-period EMA, with a 9-period EMA signal line. It may help identify momentum shifts, but like all technical indicators, it can produce false signals.
- Signal line crossovers, centerline crossovers, and histogram analysis are three common methods some traders use to interpret MACD output.
- Alpaca's Market Data API⁴ can help retrieve historical OHLCV bar data, which can then be used to compute MACD values in Python with libraries such as pandas.
- Alpaca's Trading API² can help submit orders programmatically when crossover conditions are detected, including through Alpaca's paper trading environment for simulated execution.
- MACD-based strategies carry the same risks as any trading approach. Signals may lag price action, and crossovers can generate false positives in sideways or choppy markets.
- All API keys can be stored in environment variables or .env files and never committed to version control.
This article is for general informational and educational purposes only. All examples are for illustrative purposes only.This content is for educational purposes only. Trading strategies, including those based on MACD, involve significant risk and may result in losses.
This article was commissioned and compensated by Alpaca. The content was developed for informational purposes and reflects an educational comparison of publicly available information. Compensation was provided for content creation and distribution.
What Is MACD?
MACD stands for Moving Average Convergence Divergence. According to StockCharts' ChartSchool¹, it is a trend-following momentum indicator that shows the relationship between two exponential moving averages of a security's price.
MACD consists of three components:
- MACD Line: The difference between the 12-period EMA and the 26-period EMA of closing prices.
- Signal Line: A 9-period EMA of the MACD line itself.
- Histogram: The difference between the MACD line and the signal line, displayed as a bar chart.
The standard parameter set (12, 26, 9) is commonly used as a default on many charting platforms and in technical analysis references. According to StockCharts' ChartSchool¹, the values of 12, 26, and 9 are the typical settings used with the MACD, though other values can be substituted depending on trading style and goals.
How MACD Is Calculated
The MACD formula uses exponential moving averages of closing prices:
MACD Line = EMA(close, 12) - EMA(close, 26)
Signal Line = EMA(MACD Line, 9)
Histogram = MACD Line - Signal Line
The 12-period EMA reacts more quickly to recent price changes, while the 26-period EMA provides a smoother, longer-term view. When the shorter EMA is above the longer EMA, the MACD line is positive. When it is below, the MACD line is negative.
Why Some Traders Use MACD
MACD is one of many technical indicators referenced in technical analysis literature because it combines trend direction and momentum into a single indicator.
Common use cases include:
- Identifying potential momentum shifts when the MACD line crosses the signal line
- Gauging trend strength through histogram expansion or contraction
- Filtering trade setups alongside other indicators, such as RSI or Bollinger Bands
It is important to note that MACD is a lagging indicator. Because it is derived from moving averages, signals may arrive after a trend has already begun or ended. In range-bound or choppy markets, MACD crossovers may generate false signals.
Types of MACD Crossovers
Three crossover types are commonly referenced in technical analysis literature:
Signal Line Crossover
A signal line crossover occurs when the MACD line crosses the signal line:
- Bullish signal line crossover: The MACD line crosses above the signal line. Some traders interpret this as an indication that upward momentum may be increasing.
- Bearish signal line crossover: The MACD line crosses below the signal line. Some traders interpret this as an indication that downward momentum may be increasing.
Signal line crossovers are the most frequently used MACD signals, according to StockCharts' ChartSchool¹. However, according to the same source, signal line crossovers at positive or negative extremes can be viewed with caution, and crossovers in low-volatility environments may be less reliable.
Centerline (Zero Line) Crossover
A centerline crossover occurs when the MACD line crosses the zero line:
- Bullish centerline crossover: The MACD line moves from negative to positive, meaning the 12-period EMA has crossed above the 26-period EMA.
- Bearish centerline crossover: The MACD line moves from positive to negative, meaning the 12-period EMA has crossed below the 26-period EMA.
According to StockCharts' ChartSchool¹, centerline crossovers are the next most common MACD signals after signal line crossovers, and may confirm broader trend direction.
Histogram Reversal
The MACD histogram represents the distance between the MACD line and the signal line. When the histogram bars shrink toward zero, it may indicate that a crossover is approaching. According to StockCharts' ChartSchool⁵, Thomas Aspray developed the MACD histogram to anticipate signal line crossovers in MACD.
Limitations of MACD Crossovers
- MACD is a lagging indicator. Signals may arrive after a price move has already occurred.
- In sideways or low-volatility markets, MACD may produce frequent crossovers that do not lead to sustained trends (sometimes called "whipsaws").
- MACD does not have upper or lower boundaries, making it less useful for identifying overbought or oversold conditions compared to bounded oscillators like RSI.
- Crossover signals cannot be used in isolation. Many practitioners combine MACD with other tools such as volume analysis, support/resistance levels, or additional indicators.
Prerequisites
Before implementing the code examples in this guide, you will need:
- Alpaca’s Trading API account (paper trading does not require funded capital)
- uv Python package manager
- Python 3.12 or later installed
- The following Python packages:
alpaca-py,pandas,python-dotenv - API keys from your Alpaca’s dashboard (stored securely, as described below)
Install the required packages:
!uv pip install alpaca-py pandas python-dotenvFor additional SDK details, refer to the Alpaca-py documentation and the Alpaca’s GitHub repository.
API Key Configuration Using Environment Variables
API keys may be stored outside source files to reduce the risk of accidental exposure. Using a .env file or environment variables is a common practice. Keys must never be committed to repositories. Add .env to your .gitignore file.
The following pattern supports both local development and Google Colab environments:
import os
from dotenv import load_dotenv
import sys

if "google.colab" in sys.modules:
    # In Google Colab environment, fetch API keys from Secrets.
    # Users can set ALPACA_API_KEY and ALPACA_SECRET_KEY
    # in Colab Secrets via the sidebar.

    from google.colab import userdata

    ALPACA_API_KEY = userdata.get("ALPACA_API_KEY")
    ALPACA_SECRET_KEY = userdata.get("ALPACA_SECRET_KEY")

else:
    # Store API keys safely and never commit them to repositories.
    # Use .gitignore for .env files.

    load_dotenv()

    ALPACA_API_KEY = os.environ.get("ALPACA_API_KEY")
    ALPACA_SECRET_KEY = os.environ.get("ALPACA_SECRET_KEY")
Your .env file can contain:
ALPACA_API_KEY=<insert_key_here>
ALPACA_SECRET_KEY=<insert_secret_here>
For production deployments, consider using a dedicated secrets manager (such as AWS Secrets Manager or HashiCorp Vault) instead of .env files. Never share API keys in public repositories, chat messages, or documentation.
Fetching Historical Bar Data with Alpaca's Market Data API
To compute MACD, you need historical OHLCV (Open, High, Low, Close, Volume) bar data. Alpaca's Market Data API⁴ provides access to historical stock data for a range of symbols. For details on available data coverage, see the Alpaca-py Market Data documentation⁹.
The following snippet shows how to initialize the StockHistoricalDataClient and request daily bars using alpaca-py. This data forms the input for MACD computation.
Initializing the Market Data Client
from alpaca.data.historical import StockHistoricalDataClient
# Initialize the client with your API credentials
from alpaca.data.historical.stock import StockHistoricalDataClient
data_client = StockHistoricalDataClient(
    ALPACA_API_KEY,
    ALPACA_SECRET_KEY
)
The StockHistoricalDataClient provides methods to request bars, quotes, and trades. For MACD, closing price bars are typically sufficient.
Requesting Historical Bars
from alpaca.data.requests import StockBarsRequest
from alpaca.data.timeframe import TimeFrame
from datetime import datetime, timedelta

# Define request parameters
request_params = StockBarsRequest(
    symbol_or_symbols="SPY",
    timeframe=TimeFrame.Day,
    start=datetime.now() - timedelta(days=120),
    end=datetime.now() - timedelta(days=1)
)

# Fetch bars and convert to a pandas DataFrame
bars = data_client.get_stock_bars(request_params)
df = bars.df
What this code does: It requests daily bar data for SPY over the past 120 days. This provides enough data points to compute the 26-period EMA and subsequent MACD values. The .df property converts the response into a pandas DataFrame indexed by symbol and timestamp.
Why 120 days: Computing the 26-period EMA requires at least 26 prior data points, and additional history can help the EMA values stabilize. A 120-day window provides a reasonable buffer for the standard (12, 26, 9) parameters.
When to use this: Anytime you need to compute technical indicators from historical closing prices before making a trading decision.
For more details on available timeframes and data types, see the Historical Stock Data documentation.
Computing MACD in Python with pandas
Once you have a DataFrame of historical closing prices, MACD can be calculated using the pandas ewm() method, which computes exponential moving averages.
Calculating the MACD Line, Signal Line, and Histogram
import pandas as pd

def compute_macd(df, fast=12, slow=26, signal=9):
    """
    Compute MACD line, signal line, and histogram
    from a DataFrame with a 'close' column.
    """
    close = df["close"]

    # Calculate the fast and slow EMAs
    ema_fast = close.ewm(span=fast, adjust=False).mean()
    ema_slow = close.ewm(span=slow, adjust=False).mean()

    # MACD line is the difference between fast and slow EMAs
    df["macd_line"] = ema_fast - ema_slow

    # Signal line is the EMA of the MACD line
    df["signal_line"] = df["macd_line"].ewm(
        span=signal, adjust=False
    ).mean()

    # Histogram is the difference between MACD and signal
    df["histogram"] = df["macd_line"] - df["signal_line"]

    return df
What this code does: It adds three new columns to the DataFrame: macd_line, signal_line, and histogram. These correspond directly to the standard MACD components described earlier.
Why use ewm(span=..., adjust=False): The span parameter sets the decay in terms of the number of periods. Setting adjust=False uses the recursive EMA formula, which is the standard method for MACD computation. The pandas ewm documentation¹¹ provides additional detail.
When to use this: After fetching historical bar data and before running crossover detection logic.
Detecting MACD Crossover Events
A crossover event can be detected by comparing the relative positions of the MACD line and signal line across consecutive time periods. If the MACD line was below the signal line in the previous period and is now above it, a bullish crossover has occurred (and vice versa for a bearish crossover).
Signal Line Crossover Detection
def detect_signal_crossover(df):
"""
Detect bullish and bearish signal line crossovers.
Returns the most recent signal: 'bullish', 'bearish',
or 'none'.
"""
if len(df) < 2:
return "none"
prev = df.iloc[-2]
curr = df.iloc[-1]
prev_diff = prev["macd_line"] - prev["signal_line"]
curr_diff = curr["macd_line"] - curr["signal_line"]
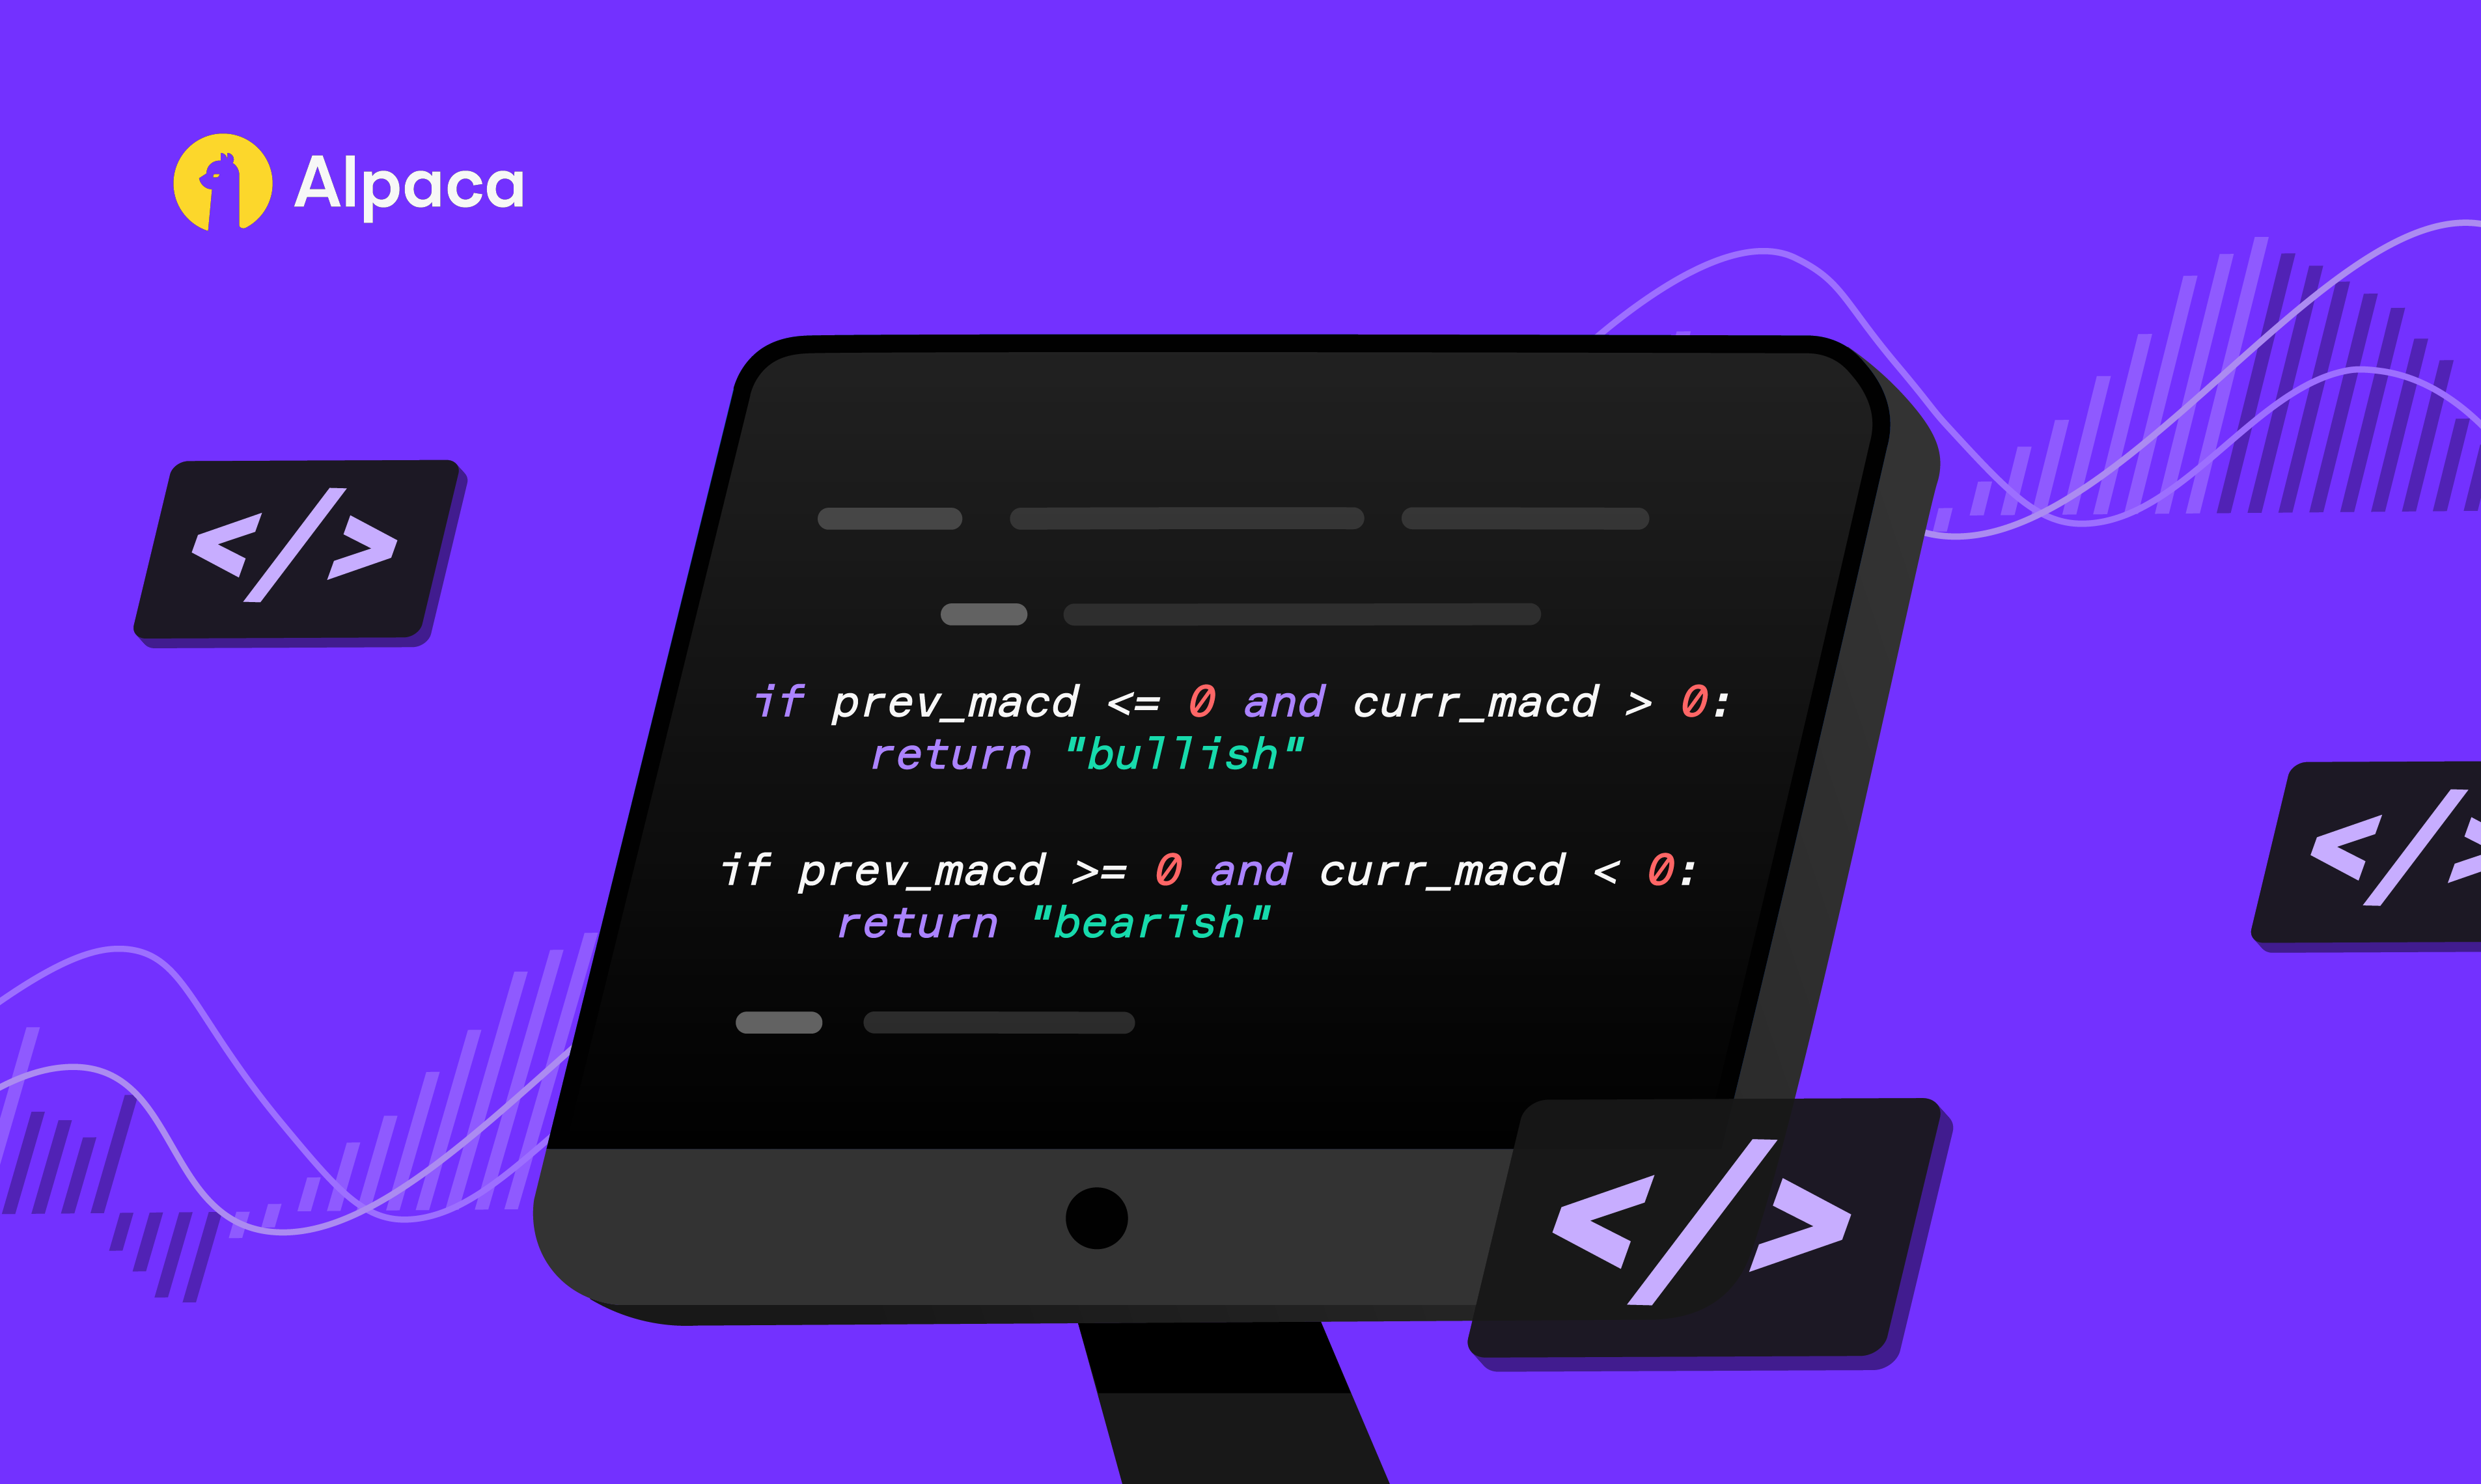
# Bullish crossover: MACD crosses above signal
if prev_diff <= 0 and curr_diff > 0:
return "bullish"
# Bearish crossover: MACD crosses below signal
if prev_diff >= 0 and curr_diff < 0:
return "bearish"
return "none"What this code does: It compares the difference between the MACD line and signal line for the two most recent bars. A sign change from negative to positive indicates a bullish crossover; positive to negative indicates a bearish crossover.
Why check consecutive bars: Crossovers are defined as the moment the MACD line transitions from one side of the signal line to the other. Checking only the current bar is insufficient to confirm a transition.
When to use this: As part of a strategy loop that runs on each new bar to determine whether a crossover condition has been met.
Centerline Crossover Detection
def detect_centerline_crossover(df):
    """
    Detect whether the MACD line has crossed
    the zero line.
    """
    if len(df) < 2:
        return "none"

    prev_macd = df.iloc[-2]["macd_line"]
    curr_macd = df.iloc[-1]["macd_line"]

    if prev_macd <= 0 and curr_macd > 0:
        return "bullish"

    if prev_macd >= 0 and curr_macd < 0:
        return "bearish"

    return "none"
What this code does: It checks whether the MACD line has crossed from below to above zero (bullish) or from above to below zero (bearish).
Why this matters: A centerline crossover confirms that the shorter-term EMA has crossed the longer-term EMA, which some traders interpret as a broader trend shift. It may be used as an additional confirmation filter alongside signal line crossovers.
Submitting Orders with Alpaca's Trading API
When a crossover condition is detected, you can use Alpaca's Trading API² to submit orders. The examples below use Alpaca's paper trading environment, which simulates order execution using real market data in a simulated environment that does not involve real capital.
Initializing the Trading Client
from alpaca.trading.client import TradingClient

trading_client = TradingClient(
    ALPACA_API_KEY,
    ALPACA_SECRET_KEY,
    paper=True  # Use paper trading environment
)
Setting paper=True directs all requests to Alpaca's paper trading endpoint. This can be useful for testing strategies in a simulated environment before considering any live deployment. For more on paper trading, see Alpaca's paper trading documentation¹².
Submitting a Market Order
from alpaca.trading.requests import MarketOrderRequest
from alpaca.trading.enums import OrderSide, TimeInForce

def submit_market_order(symbol, qty, side):
    """
    Submit a market order through Alpaca's Trading API.
    """
    order_data = MarketOrderRequest(
        symbol=symbol,
        qty=qty,
        side=side,
        time_in_force=TimeInForce.DAY
    )
    order = trading_client.submit_order(order_data=order_data)
    return order
What this code does: It creates and submits a market order for a given symbol, quantity, and side (buy or sell). The TimeInForce.DAY setting means the order is valid for the current trading session only.
Why use market orders in examples: Market orders are the simplest order type for demonstration purposes. In practice, some traders may prefer limit orders to control execution price. See Alpaca's order types documentation¹³ for the full range of available order types.
When to use this: When your crossover detection logic returns a signal and your strategy's conditions are met.
Checking Existing Positions
Before placing a new order, it is common to check whether you already hold a position in the symbol:
def get_position(symbol):
    """
    Check if a position exists for the given symbol.
    Returns the position object or None.
    """
    try:
        position = trading_client.get_open_position(symbol)
        return position
    except Exception:
        return None
What this code does: It queries Alpaca for any open position in the specified symbol. If no position exists, the API raises an exception, which this function catches and returns None.
Why check positions: To help prevent duplicate entries or to determine whether an exit signal can trigger a sell order.
Assembling a Hypothetical MACD Crossover Strategy
The following example brings together the components above into a single hypothetical strategy loop. This is a simplified illustration and is not intended as a recommendation or a production-ready system.
def run_macd_strategy(symbol="SPY", qty=1):
    """
    Hypothetical MACD crossover strategy.
    Fetches data, computes MACD, checks for crossovers,
    and submits paper trading orders.

    This is for educational purposes only.
    """
    # Fetch historical data
    request_params = StockBarsRequest(
        symbol_or_symbols=symbol,
        timeframe=TimeFrame.Day,
        start=datetime.now() - timedelta(days=120),
        end=datetime.now() - timedelta(days=1)
    )
    bars = data_client.get_stock_bars(request_params)
    df = bars.df

    # Handle multi-index if present
    if isinstance(df.index, pd.MultiIndex):
        df = df.xs(symbol, level="symbol")

    # Compute MACD
    df = compute_macd(df)

    # Detect crossover
    signal = detect_signal_crossover(df)

    # Check current position
    position = get_position(symbol)

    if signal == "bullish" and position is None:
        print(f"Bullish crossover detected for {symbol}. "
              f"Submitting buy order.")
        submit_market_order(symbol, qty, OrderSide.BUY)

    elif signal == "bearish" and position is not None:
        held_qty = int(float(position.qty))
        print(f"Bearish crossover detected for {symbol}. "
              f"Submitting sell order for {held_qty} shares.")
        submit_market_order(symbol, held_qty, OrderSide.SELL)

    else:
        print(f"No actionable signal for {symbol}. "
              f"Signal: {signal}")
The following example is a simplified technical illustration of how indicator signals might be translated into programmatic logic. It omits important considerations such as transaction costs, slippage, latency, and risk management, and should not be interpreted as a complete or recommended trading system.
What this code does: It runs through the full workflow: fetching data, computing MACD, checking for a crossover, verifying position status, and conditionally placing a paper trade.
Limitations of this example:
- It does not include position sizing or risk management logic (e.g., stop-loss or take-profit levels).
- It runs once and exits. A production system would need scheduling (e.g., cron, AWS Lambda, or a loop with appropriate delays).
- It uses daily bars. Intraday strategies would require minute-level or hourly data with different considerations.
- Market orders may experience slippage. Limit orders or other order types may be more appropriate depending on the use case.
- This example does not account for market hours, trading halts, or other operational factors.
For a more detailed example of deploying a trading bot with MACD and RSI using Alpaca, see the tutorial How to Build a Free RSI and MACD Trading Bot with ChatGPT and Alpaca¹⁴ and the accompanying GitHub repository¹⁵.
Additional Use Cases and Considerations
Combining MACD with Other Indicators
Some traders combine MACD crossovers with additional filters to attempt to reduce false signals. Common pairings include:
- RSI (Relative Strength Index): Used to filter MACD signals when RSI indicates overbought or oversold conditions. Alpaca's RSI and MACD trading bot tutorial¹⁴ demonstrates this combination.
- Bollinger Bands: Some traders look for MACD crossovers that coincide with price touching Bollinger Band boundaries.
- Volume confirmation: Requiring above-average volume during a crossover may help filter out signals in low-liquidity conditions.
For a broader overview of technical analysis with Alpaca, see Technical Analysis with TA-Lib and Market Data API¹⁶.
Using Different Timeframes
The standard (12, 26, 9) settings are designed for daily charts. When applying MACD to other timeframes:
- Intraday (1-minute, 5-minute, or hourly bars): Shorter bar intervals may produce more frequent crossovers. Some traders adjust the MACD parameters in an attempt to reduce noise on shorter timeframes. For example, settings such as (8, 17, 9) are sometimes used for shorter-term analysis, according to StockCharts' ChartSchool¹.
- Weekly or monthly bars: Longer timeframes may produce fewer but potentially more significant crossover signals. According to StockCharts' ChartSchool¹, MACD(5,35,5) may be better suited for weekly charts.
Alpaca's Market Data API supports multiple timeframes including TimeFrame.Minute, TimeFrame.Hour, TimeFrame.Day, and TimeFrame.Week. See the historical stock data documentation for the full list.
Backtesting Before Live Deployment
Before deploying any strategy with real capital, backtesting against historical data is standard practice. Backtesting involves applying the strategy logic to historical price data to observe how it would have performed.
Key considerations for backtesting:
- Past performance, whether actual or based on backtesting or simulation, is not indicative of future results. Hypothetical or simulated performance results have inherent limitations and do not reflect actual trading conditions, including liquidity constraints, execution delays, or transaction costs.
- Backtests may not account for slippage, partial fills, or market impact.
- Overfitting to historical data is a concern frequently discussed in quantitative finance. A strategy that performs well in backtesting may not perform similarly in live markets.
Alpaca's resources include guides on backtesting with VectorBT¹⁷ and backtesting 0DTE Bull Put Spread options strategies¹⁸. For broader strategy development context, see Building Your Algorithmic Trading Setup¹⁹.
Paper Trading as a Testing Environment
Alpaca's paper trading environment¹² simulates order execution using real market data without involving real capital. This can help:
- Test whether code executes correctly
- Observe how the strategy behaves during live market hours
- Identify bugs or edge cases before moving to a funded account
Paper trading uses the same API endpoints and SDK methods as live trading, with paper=True set on the TradingClient. It is important to note that simulated results from paper trading may not reflect the conditions of live trading, including factors such as slippage, partial fills, and real-time liquidity. For a detailed comparison between paper and live trading, see Paper Trading vs. Live Trading: A Data-Backed Guide²⁰.
Logging and Monitoring
For strategies that run autonomously, logging can be important for debugging and performance review. Consider logging:
- Timestamps and signal values at each evaluation
- Order submission confirmations and fill details
- Error messages and exception traces
- Account balance and position snapshots
Python's built-in logging module or third-party tools can be used for this purpose. The Alpaca trading bot tutorial¹⁴ includes an example of logging configuration for an automated system deployed on AWS EC2.
Risk Considerations
All trading strategies, including those based on MACD crossovers, carry risk. Some specific risks to consider:
- False signals: MACD crossovers may generate signals that do not result in sustained price movements, particularly in range-bound or choppy markets.
- Lag: Because MACD is derived from moving averages, signals are inherently delayed relative to actual price changes.
- Market conditions: Strategies that may perform well in trending markets may underperform or generate losses in sideways markets.
- Execution risk: Market orders may not fill at the expected price due to slippage, particularly in fast-moving or low-liquidity conditions.
- Automation risk: Automated systems can execute orders rapidly, which may amplify losses if the underlying logic contains errors.
- Data quality: Incorrect or delayed data can lead to erroneous signal generation.
There is always the potential of losing money when investing in securities or other financial products. For more on the risks of automated trading, see Risks of Automated Trading Systems²¹.
Frequently Asked Questions
What are the standard MACD settings, and can they be adjusted?
The standard MACD settings are (12, 26, 9), representing the fast EMA period, slow EMA period, and signal line EMA period, respectively. These values are commonly used as the default on many charting platforms. Some traders adjust these parameters based on the asset being traded or the timeframe. For example, according to StockCharts' ChartSchool¹, (5, 35, 5) may be better suited for weekly charts, and (8, 17, 9) is sometimes used for shorter-term analysis. There is no single set of parameters that is optimal for all market conditions.
How can I use MACD crossovers with Alpaca's paper trading?
You can fetch historical bar data using Alpaca's StockHistoricalDataClient, compute MACD in Python with pandas, and submit paper trade orders using the TradingClient with paper=True. The full workflow is demonstrated in the code examples in this guide. For a complete working example, see the Alpaca GitHub repository¹⁵.
Can MACD be applied to intraday trading?
MACD can be applied to any timeframe, including intraday bars (e.g., 1-minute, 5-minute, or hourly). However, shorter timeframes may produce more frequent crossovers and potentially more false signals. Some traders adjust the MACD parameters or add additional filters when using shorter timeframes. Alpaca's Market Data API supports minute-level bar data²² that can be used for intraday MACD computation.
Should I use MACD alone to make trading decisions?
MACD is one of many technical analysis tools. Using it in isolation may result in acting on signals that lack confirmation from other market factors. Many practitioners combine MACD with other indicators (such as RSI, volume, or moving averages), price action analysis, and fundamental research. No single indicator can reliably predict future price movements.
What are the main risks of automating a MACD-based strategy?
Automated strategies can execute orders without human intervention, which may amplify both gains and losses. Key risks include acting on false crossover signals, errors in code logic, API connectivity issues, and unexpected market conditions such as gaps or flash crashes. Thorough testing in a paper trading environment, robust error handling, position sizing controls, and regular monitoring can help mitigate some of these risks. For additional context, see Alpaca's guide on risks of automated trading systems²¹.
References
- MACD (Moving Average Convergence/Divergence) Oscillator, StockCharts ChartSchool.
- Trading API, Alpaca.
- How to Start Paper Trading with Alpaca's Trading API, Alpaca, February 2021.
- About Market Data API, Alpaca.
- MACD-Histogram, StockCharts ChartSchool.
- Sign Up, Alpaca.
- Alpaca-py SDK Getting Started, Alpaca.
- GitHub Repository, Alpaca.
- Alpaca-py Market Data Documentation, Alpaca.
- Historical Stock Data, Alpaca.
- DataFrame.ewm Documentation, pandas.
- Paper Trading, Alpaca.
- Orders at Alpaca, Alpaca.
- How to Build a Free RSI and MACD Trading Bot with ChatGPT and Alpaca, Alpaca, May 2025.
- Build Trading Bot with ChatGPT (GitHub), Alpaca.
- Technical Analysis with TA-Lib and Market Data API, Alpaca, February 2022.
- Introduction to Backtesting with VectorBT, Alpaca, January 2022.
- Backtesting 0DTE Options: The Complete Guide to Strategy, Setup & Performance, Alpaca, August 2025.
- Building Your Algorithmic Trading Setup, Alpaca, February 2024.
- Paper Trading vs. Live Trading: A Data-Backed Guide on When to Start Trading Real Money, Alpaca, August 2025.
- Stock Bars API Reference, Alpaca.
Nothing in this article constitutes investment, legal, or tax advice, nor does it constitute a recommendation or endorsement by Alpaca. Any third-party descriptions, comparisons, platform features, statements, or images are provided by such third parties, have not been independently verified by Alpaca, and do not constitute a recommendation or endorsement by Alpaca.
Past hypothetical backtest results do not guarantee future returns, and actual results may vary from the analysis.
Investing and trading involve risk, including the potential loss of principal. Past performance (whether actual or backtested) is not indicative of future results. No investment strategy is guaranteed to achieve its objectives. Diversification does not ensure a profit or protect against loss. Investors should consider their investment objectives and risks carefully before investing.
Options trading is not suitable for all investors due to its inherent high risk, which can potentially result in significant losses. Please read “Characteristics and Risks of Standardized Options” before investing in options.
Securities brokerage services are provided by Alpaca Securities LLC (dba "Alpaca Clearing"), member FINRA/SIPC, a wholly-owned subsidiary of AlpacaDB, Inc. Technology and services are offered by AlpacaDB, Inc.
This is not an offer, solicitation of an offer, or advice to buy or sell securities or open a brokerage account in any jurisdiction where Alpaca Securities is not registered or licensed, as applicable.