This is the sequel to the article, “How a College Student Learned About Options Trading – Part 1.” If you are not familiar with options trading, we recommend reading Part 1 first to familiarize and help build on the terms in this article.
In the first blog, my goal was to help you understand some of the basics of American-style, standard options trading, including the process of buying call and put options, as well as how they differ from other types of securities trading. Now you might be wondering, “what are some of the possible next steps for understanding options trading?”
While coding languages like Python and tools like Alpaca’s Trading API can eventually help automate your trades, it's crucial to first understand the fundamentals of what you’re trading. So before you start trading options, especially algorithmically, it’s essential to grasp a few more key terms that regularly appear. Understanding these concepts can help enable you to read options chains and identify when an option may have upside potential.
Decoding Options Chains: The Complete Guide
There are many important things to learn about trading options. One of the key skills to learn for options trading is understanding an options chain.
What Are Option Chains?
An options chain can provide many different data points for options. And depending on where you trade, they can generally be sorted and filtered in different ways to find the information that’s important for you. For example, you can browse options contracts by strike price (the price at which the underlying asset will be bought or sold if the option is exercised or assigned), expiration date (the last trading day that an option can be exercised), and more.
The table below, sourced from Nasdaq, displays options chain for AMZN stock as of October 11, 2024. It provides key information like expiration date, strike price, premiums, and trading volumes for both call and put options. As a note, we are using AMZN as an example, and it should not be considered investment advice.

There are a lot of new terms and numbers in this image, but before we explore the details, I found that once I grasped essential terms—like options moneyness, especially with clear examples—understanding the mechanisms of options trading became much easier.
Options Moneyness (ITM, OTM, ATM)
Options moneyness measures the relationship between an option's strike price and the current market price of the underlying asset, determining the intrinsic value and profit potential of an option in its current state.
In options trading, there are three key moneyness categories:
- In The Money (ITM)
- Out Of The Money (OTM)
- At The Money (ATM)
These classifications help traders assess an option’s value and make strategic decisions. We go through each scenario for both calls and puts cases below.
We can use the same example using Stock A and Stock B from Part 1. Again, it’s important to note that most options contracts represent 100 shares of the underlying stock or security. However, there are some non-standard options contracts as well which are discussed in Part 1. In our example below, we are assuming the contracts represent 100 shares of the underlying stock.
Call Options Example
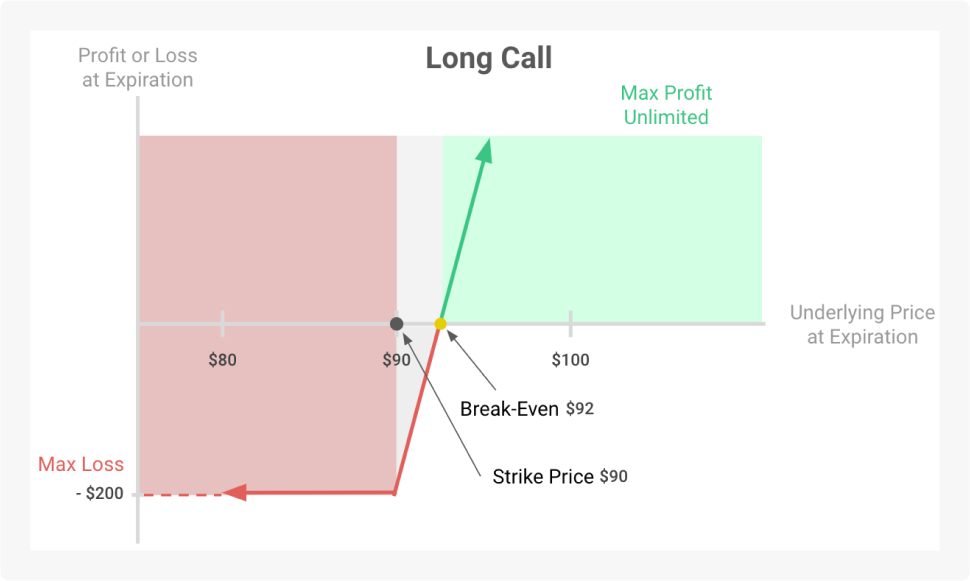
For the sake of simplicity, we will use the same Stock A examples from Part 1, focusing on American-style options. To make the information easier to visualize and digest, we will use an option profit and loss diagram. These diagrams are visual aids that illustrate where options strategies make or lose money at expiration based on the underlying asset's price.
When Is A Call Option In The Money?
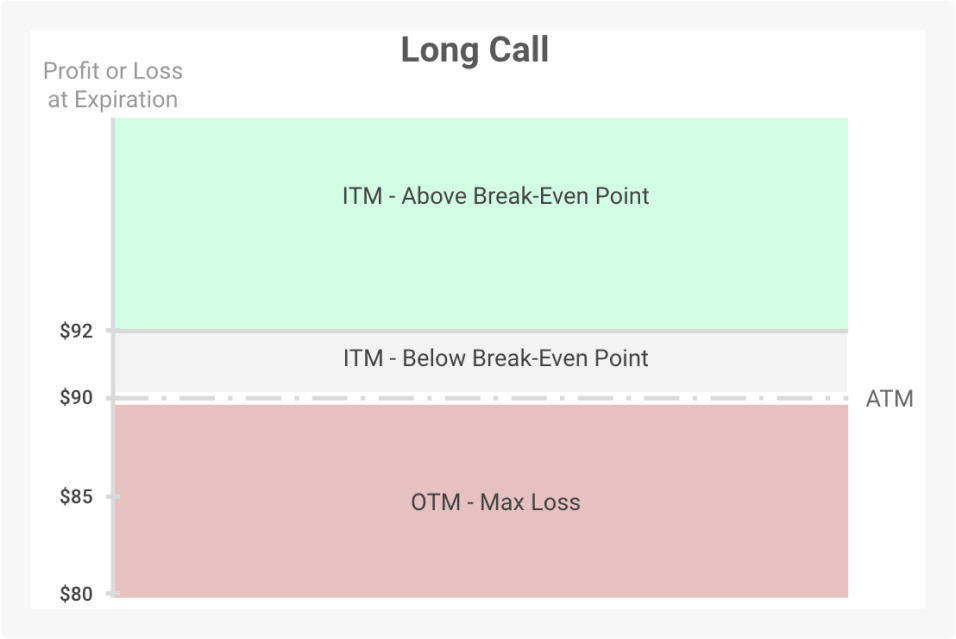
If we buy a call option with a strike price of $90, the option is in-the-money (ITM) if the stock price is above $90, since you can buy the stock for $90 when it's trading above that price (e.g. $100 gives $10 of intrinsic value). However, even if it's ITM, it may still be in a losing position if it hasn’t reached the break-even price (strike price + premium paid). The option becomes profitable only when the stock price exceeds both the strike price plus the premium ($2 in this example).
When Is A Call Option At The Money?
The option is at-the-money (ATM) when the stock price is exactly $90, matching the strike price. There is no intrinsic value because buying at $90 equals the market price. However, the option still may have extrinsic value due to the $2 premium.
In this example, if the stock stays exactly at the money leading up until expiration, the premium will go down as the option gets closer to expiration. This is known as time decay. If the stock stays at $90 until expiration, you would lose the premium ($200 for 100 shares), and the right to buy the option expires.
When Is A Call Option Out Of The Money?
The option is out-of-the-money (OTM) if the stock price is below $90. For example, if the stock is at $85, the option is OTM because paying $90 for something worth $85 wouldn’t be beneficial. In this case, the option expires worthless, and your maximum loss would be the premium paid ($200), as you wouldn’t exercise it with a better market price available.
Let's look at a different perspective on long call moneyness as it relates to a stock chart. Remember that for an ITM call option to generate profit, the stock price should exceed the break-even threshold.
Put Options Example
For a put option, you should expect the inverse of what happens in a call option.
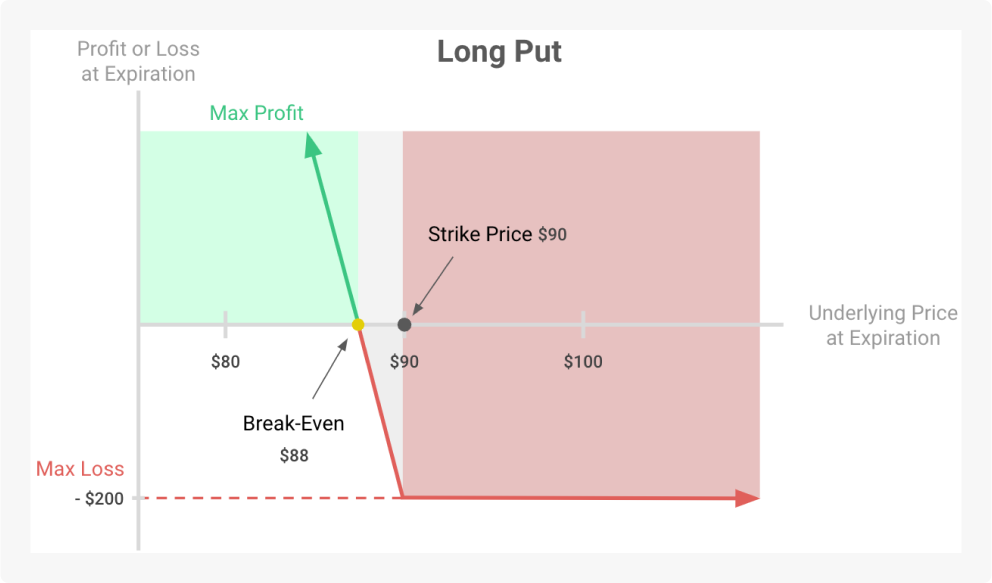
We will use the example of Stock B from Part 1 where stock B is currently priced at $90, and there is a belief that the price will go down. You buy the put option with a strike price of $90, expiring in one month, with the option premium being $2 per share.
Let’s check an option profit and loss diagram for the long put.
When Is A Put Option In The Money?
The option is ITM if the stock price is lower than $90 because you can sell the stock for $90 when it is trading at $80 ($10 of intrinsic value). So, the y-axis in the diagram above shows that the option contract moves toward profitability as the stock price falls below $90, and a loss when the stock price is above $90.
When Is A Put Option At The Money?
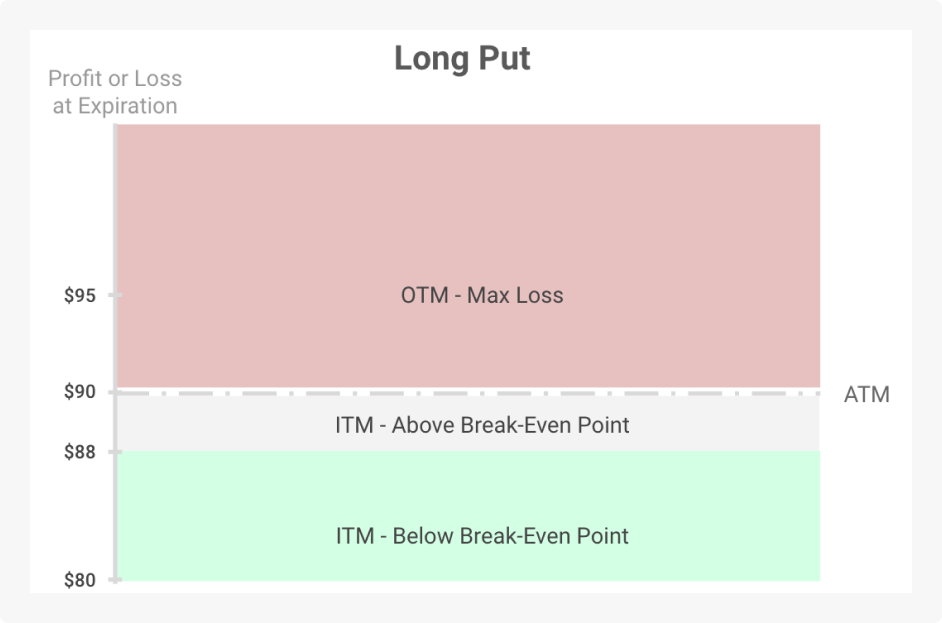
The option is ATM if the stock price is exactly $90, matching the strike price. In this case, there is no profit or intrinsic value since you’re selling at the same price as the current market. You would still lose the premium ($200 for 100 shares), and the option expires.
When Is A Put Option Out Of The Money?
The option is OTM if the stock price is above $90. For example, if the stock price is $95, you wouldn’t sell at $90 since the stock is worth more in the market. They would let the option expire, and your maximum loss is the premium paid ($200 for 100 shares). In the long put case, the underlying stock must be below the break-even point for an ITM money option to be profitable, which you can see in the simplified diagram below.
Terms To Know for Options Trading Success
Now that you understand options moneyness and have an idea of how to assess whether an option is profitable, let’s revisit the options chain I mentioned earlier. There are still some important terms that you should understand before grasping how to read an options chain.
Some of these terms were already touched upon when discussing moneyness, so feel free to go back and reference those sections as needed. And if these terms don’t click immediately after reading this section, don’t worry! You can always refer to the resources I shared earlier in this article for more in-depth explanations. Take your time and explore them as needed.
Options Chain
When you check the options chain below, you may find terms mentioned at the top of the chart that you’re unfamiliar with. These terms are crucial for understanding options chains and how they work. Let’s break them down.

Options Premium
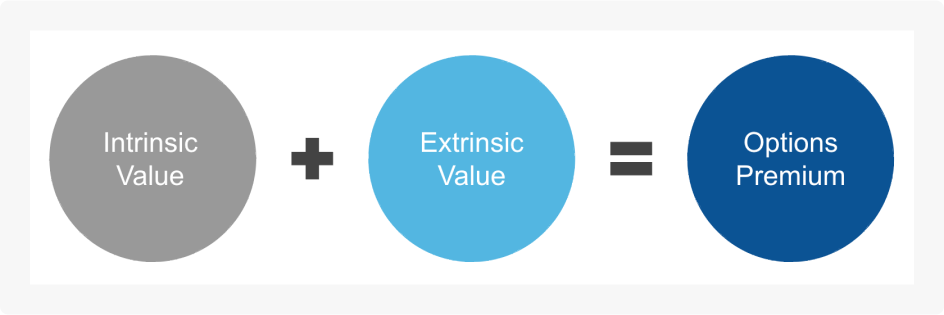
The options premium is the price of the option itself. When looking at an options chain, they can be found in the "Last," "Bid," and "Ask" columns, which show the most recent price. The bid is the highest price buyers are willing to pay, and the ask is the lowest price that sellers are willing to accept, respectively.
The premium is influenced by factors like the underlying stock price, strike price, time remaining until expiration date, implied volatility, interest rates, and more. Essentially, the premium is the total cost a trader pays to hold the option, combining intrinsic and extrinsic values. These influencing factors are analyzed using option Greeks, which measure how different factors affect the premium.
Strike Price
The strike price is listed in the "Strike" column, which is the price at which you can buy (for calls) or sell (for puts) the underlying asset in American-style options.
It is a crucial factor in determining whether the option would become profitable. For call options, profit is expected if the stock price rises above the strike price plus premium, while for put options, profit is expected when the stock price drops below the strike price plus premium.
Expiration Date (Exp. Date)
The expiration date, shown in the "Exp. Date" column, is the date by which the option expires and, if you so choose, can be exercised. In this example, the expiration date is October 11, 2024.
The expiration date is a key factor in the option’s price, as options typically lose value as expiration nears, referred to as time decay. Options with closer expiration dates typically have lower premiums because there is less time for the stock price to move in a favorable direction.
Volume
The volume is listed in the "Volume" column and shows how many contracts have been traded for that particular option on the given day.
A higher volume commonly indicates more interest in the option. High-volume options are often more liquid, allowing for smoother entry and exit from trades, and are generally considered less risky in terms of getting in and out of the market efficiently. Volume in options can change as the price of the underlying security changes. An option with high volume one day may not have high volume the next day.
Implied Volatility
Implied volatility (IV) is not directly shown in the image but influences the premium price in the “Last,” “Bid,” and “Ask” columns. It reflects the market’s expectation of future price fluctuations.
A higher volatility often means more expensive options due to the increased chance of big price moves. Traders assess IV to determine the risk and potential profit of an option based on expected price swings.
Extrinsic Value
Extrinsic Value, or time value, is also not directly shown in the image, but is the part of an option's price that reflects the potential for it to become profitable before expiration, even if it has no intrinsic value right now (even when the underlying stock is at the money).
Extrinsic value depends on factors like:
- Time Until Expiration: Typically, more time means higher extrinsic value, as the stock has longer to move. As expiration approaches, this value decreases due to time decay.
- Implied Volatility: If the market expects large price swings, extrinsic value may increase because there's a greater chance the option could become profitable.
Applying Options Trading Math with a Real Case Study (AMZN)
Now that we’ve covered the key terms, let’s put them into action. There are many platforms for options trading as well as publicly available tools like Alpaca’s Trading API. First, I will go over options trading theoretically by using Amazon’s options chain as an example. After that, I will provide an example of how to trade options using Alpaca’s Trading API.
Now that we've covered the key terms, let's put them into action. Though various platforms exist for options trading, we'll concentrate on two areas: first, understanding options trading theory through Amazon's options chain, and then learning how to trade options using Alpaca's Trading API.
Let’s get started with analyzing the Amazon stock options. When you check the Alpaca’s market dashboard for AMZN stock, you can see the current price.
Note: I conducted this example on October 24, 2024, so the numbers and data will most likely be different than the ones demonstrated here. And as mentioned above, we are using AMZN as an example. This is not a recommendation to purchase AMZN options.
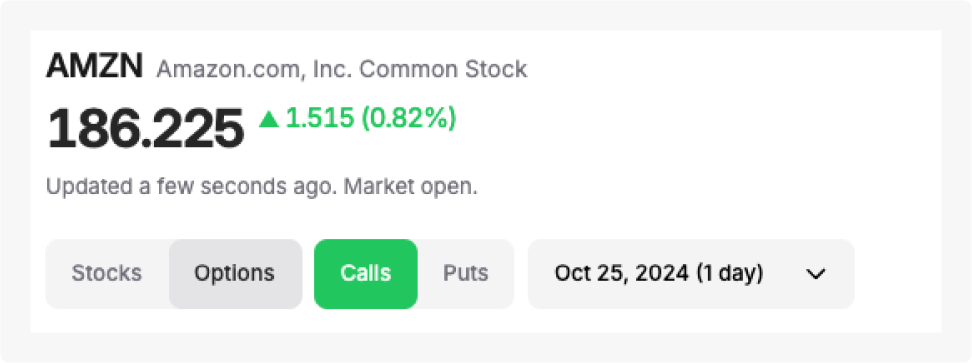
Within the same page, you should find an options chain just like the one below.
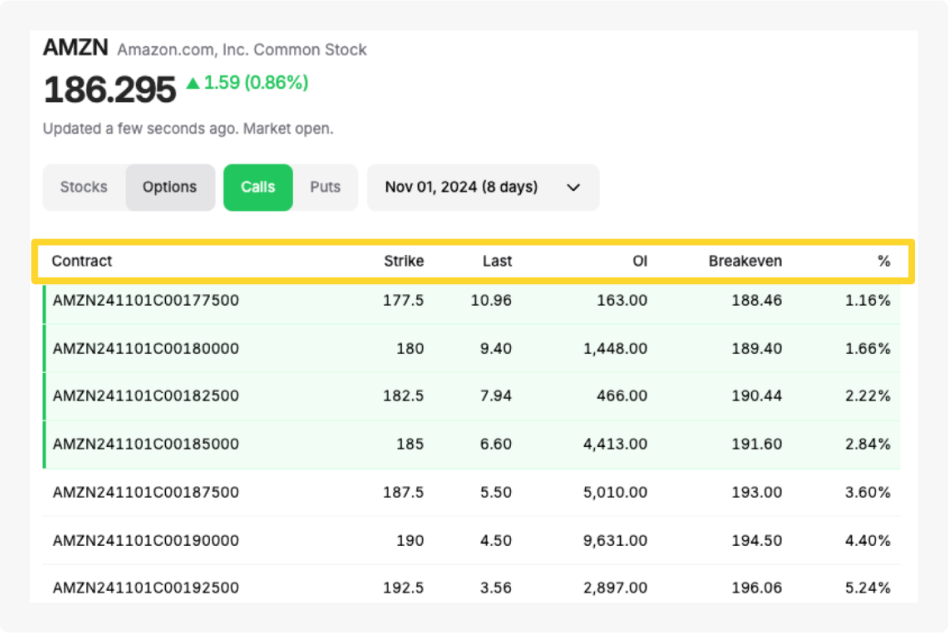
Scenario
Let’s say you expect Amazon's stock price will increase further by the end of the expiration (November 01, 2024), but you are also concerned about potential downside risk.
Action
Instead of buying shares, you purchase a call option (because you expect the price to go up) for 100 shares of Amazon stock with a strike price of $190.00 and an expiration date of one week.
If you check the “Last” column under that strike price, you can find its last premium of $4.50, meaning each contract would cost $450 (since each contract represents 100 shares).
Profit/Loss From This Scenario
- Scenario 1: If Amazon's stock were to rise to $199 before the expiration date, you can exercise the option, buy the stock at $190, and sell at $199. After subtracting the $4.50 premium, your profit would be $550 (100 x ($199 - $190 - $4.50)).
- Scenario 2: If the stock was to stay at or below $190, you may elect for the option to expire. In this case, you’d lose the $445 premium because the break-even point here would be $194.50 ($190 + $4.50), meaning it’s probably not worth it to exercise the option.
Trading Options Using Alpaca’s Trading API
Now that I’ve broken down a real-life example of an options chain and how profit and loss are measured, I can show you how to trade options using simple code on Alpaca’s Trading API. If you’re not already set on Alpaca’s paper trading environment, there are a few other resources and tutorials to read first, which we’ve linked below. If you already have an Alpaca account and paper trading environment set up, you can skip to Step 1 below.
- Create a Trading API account
- Connect your account to your API
- Start paper trading using simple, one-off stocks
Once you’ve followed those three steps, you can come back to this tutorial on how to trade options with Alpaca’s Trading API.
Using the same AMZN scenario as above, I’ve provided an example of how you can buy and sell options with a few simple lines of code.
Step 1: Connect to Alpaca’s Trading API
We can jump-start trading using Google Colab as your coding environment. Alpaca already provides some code that you can run directly in Google Colab, so there’s no need to set up your own programming environment on your laptop.
You can find them in the following documentation.
You can configure your API key and secret key, which you can generate from Alpaca’s dashboard. If you forget how to do this, read our guide on how to connect to Alpaca’s Trading API.
Note: You also want to make sure that the request actions are imported for this code to work. You can do so by following the third code block on the Google Colab notebook or by using the code below.
# Please change the following to your own PAPER api key and secret
# You can get them from https://alpaca.markets/

api_key = "<YOUR PAPER API KEY>"
secret_key = "<YOUR PAPER API SECRET>"

# We use paper environment for this example

paper = True

# Install / Import necessary packages

!python3 -m pip install alpaca-py
import alpaca
from alpaca.trading.client import TradingClient
import json
from datetime import datetime, timedelta
from zoneinfo import ZoneInfo
from alpaca.trading.requests import (MarketOrderRequest, GetOrdersRequest)
from alpaca.trading.enums import (OrderSide, OrderType,TimeInForce, QueryOrderStatus)
trade_client = TradingClient(api_key=api_key, secret_key=secret_key, paper=paper, url_override=trade_api_url)
Step 2: Find The Options You Want To Buy
For this example, we are going to use Amazon’s option chain, which can be found on Alpaca's dashboard. Again, the prices below may be different from yours depending on the date you’re following along.
If you think you can purchase the option for 100 shares of Amazon with a strike price of $190.00 and an expiration date of one week, click the option and find the symbol (this identifies the specific option). You should see something like the image below.
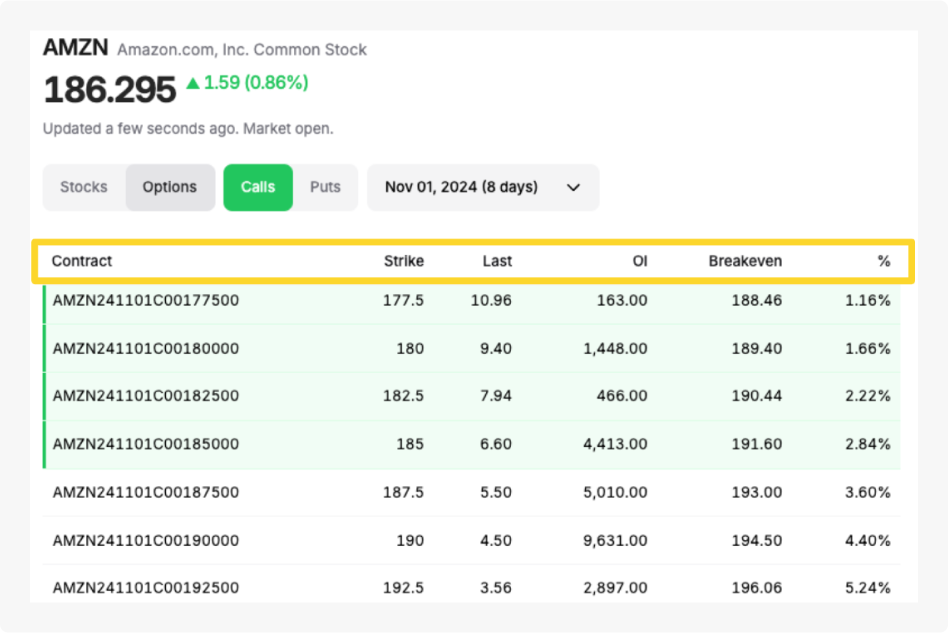
For your reference, here's a detailed breakdown of the option symbol:
- AMZN: This refers to the underlying stock, which in this case would be Amazon.
- 241101: This indicates the expiration date, which is November 1, 2024 (formatted as YYMMDD).
- C: This indicates it is a Call option.
- 00190000: This refers to the strike price, in this case, $190.
If you want to know the expiration date, you can look at the six numbers right after the underlying stock. And if you want to know the strike price, you can look at the last few numbers in the call option symbol.
For the “symbol” parameter in MarketOrderRequest, manually input the option symbol as “AMZN241101C00190000.” This call symbol may change depending on the option you choose.
Note:
- When copying the option symbol over from the Nasdaq page, make sure to delete the space between the company name and the digits after.
- The option details below can vary so make sure to change the symbols to match your target options. It will not work if you use option details from a past date.
# place buy put option order
# we can place a buy call/put option order

req = MarketOrderRequest(
    symbol = "AMZN241101C00190000",
    qty = 1,
    side = OrderSide.BUY,
    type = OrderType.MARKET,
    time_in_force = TimeInForce.DAY,
)
res = trade_client.submit_order(req)
res
After you purchase the option, you can confirm the order using this code.
# get list of orders by specifying option contract symbol

req = GetOrdersRequest(
    status = QueryOrderStatus.ALL,
    symbols = ["AMZN241101C00190000"],
    limit = 5,
)
orders = trade_client.get_orders(req)
orders
You should also be able to confirm your past orders in Alpaca’s dashboard.
While exercising options is one way to potentially profit, many traders may make gains by selling the option before expiration (closing the position), hedging, and more. At the end of the day, it is up to the trader how they want to incorporate options trading into their strategies.
Your Next Steps in Options Trading
I hope these articles have helped you understand what options trading is and how it differs from standard stock trading. I also hope it helped you understand key terms like calls, puts, and strike prices.
Personally, grasping concepts like moneyness (ITM, OTM, ATM) was a turning point for me—it made the information in an options chain much easier to understand by providing a much clearer picture. If you’re still unsure about these concepts, don’t worry! It’s okay to feel confused at first. Take your time, revisit the material, or explore the other resources I shared earlier.
Next Step
To take the next step, I recommend practicing more in a paper trading environment like Alpaca’s API. It offers a user-friendly, commission-free platform* that’s perfect for starting with options trading.
One of the standout features is the paper trading mode, which allows you to simulate real-world trades without risking actual money. It’s great for beginners building confidence and experienced traders testing new strategies. The simplicity of Alpaca’s API makes it accessible even for those without prior coding experience.
For those ready to dive deeper into options trading, the following resources provide step-by-step guides:
- How to Trade Options with Alpaca
- Alpaca's Trading API - Google Colab Notebooks
- API Documentation: Paper Trading
*Commission-free trading means that there are no commission charges for Alpaca self-directed individual cash brokerage accounts that trade U.S.-listed securities and options through an API. Relevant regulatory fees may apply. Commission-free trading is available to Alpaca's retail customers. Alpaca reserves the right to charge additional fees if it is determined that order flow is non-retail in nature.
Options trading is not suitable for all investors due to its inherent high risk, which can potentially result in significant losses. Please read Characteristics and Risks of Standardized Options before investing in options.
Please note that the content is for informational purposes and is believed to be accurate as of the posting date but may be subject to change. The examples and images above are for illustrative purposes only.
All investments involve risk and the past performance of a security, or financial product does not guarantee future results or returns. There is no guarantee that any investment strategy will achieve its objectives. Please note that diversification does not assure a profit, or protect against loss. There is always the potential of losing money when you invest in securities, or other financial products. Investors should consider their investment objectives and risks carefully before investing.
The Paper Trading API is offered by AlpacaDB, Inc. and does not require real money or permit a user to conduct real transactions in the market. Providing use of the Paper Trading API is not an offer or solicitation to buy or sell securities, securities derivative or futures products of any kind, or any type of trading or investment advice, recommendation or strategy, given or in any manner endorsed by AlpacaDB, Inc. or any AlpacaDB, Inc. affiliate and the information made available through the Paper Trading API is not an offer or solicitation of any kind in any jurisdiction where AlpacaDB, Inc. or any AlpacaDB, Inc. affiliate (collectively, "Alpaca") is not authorized to do business.
Securities brokerage services are provided by Alpaca Securities LLC ("Alpaca Securities"), member FINRA/SIPC, a wholly-owned subsidiary of AlpacaDB, Inc. Technology and services are offered by AlpacaDB, Inc.
This is not an offer, solicitation of an offer, or advice to buy or sell securities or open a brokerage account in any jurisdiction where Alpaca Securities are not registered or licensed, as applicable.

