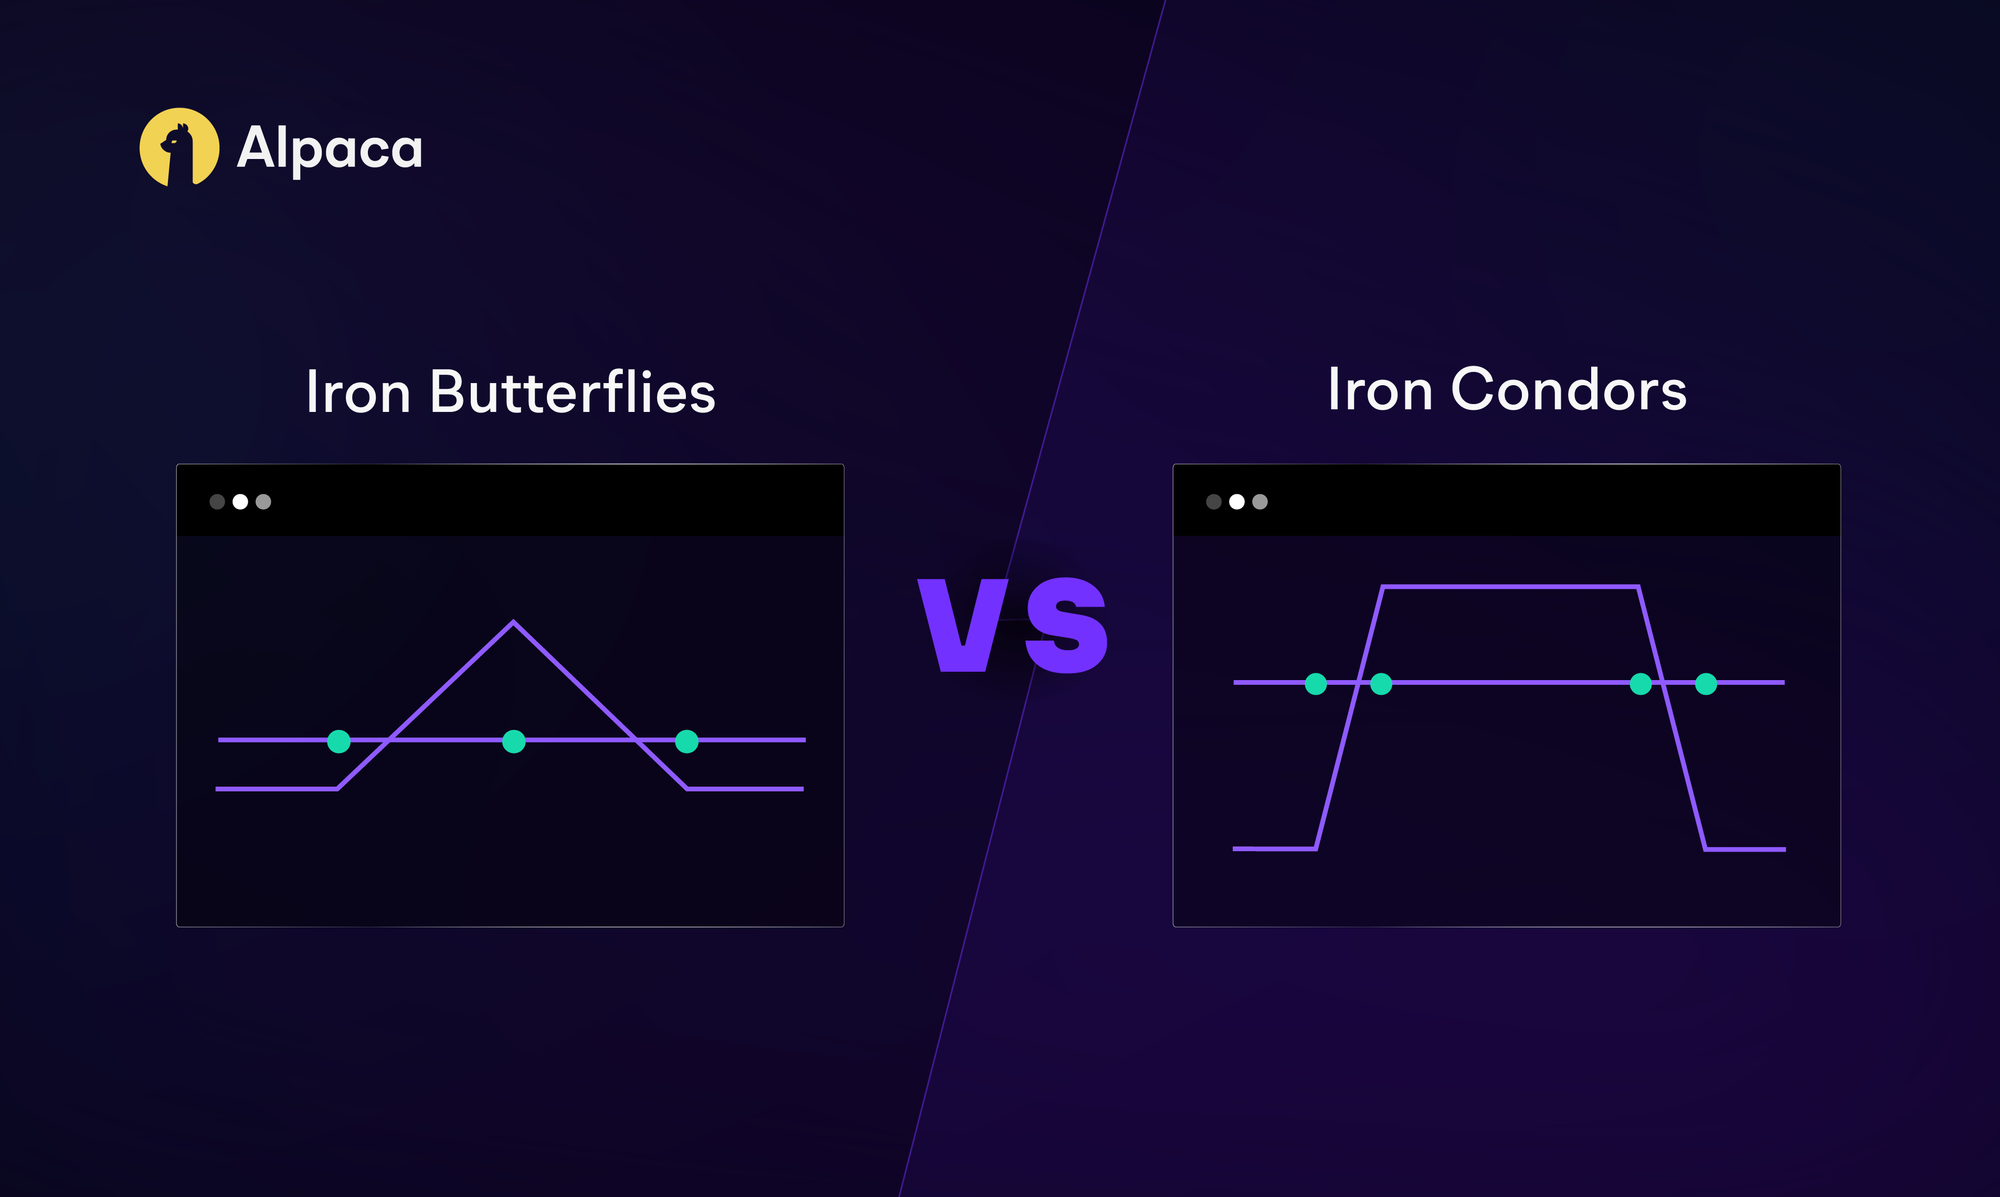
The iron condor and iron butterfly are two closely related, neutral strategies that rely on time decay and stable underlying prices. Both involve four options–two calls and two puts–with the same expiration date, and are constructed to benefit from low volatility environments, where the underlying stock’s price remains within a relatively tight trading range.
Despite these commonalities, the differences between an iron butterfly and an iron condor can impact their risk profiles, probability of profit, and suitability for algorithmic implementations. Understanding these subtleties are critical for algorithmic traders aiming to integrate such strategies into quantitative models, automated execution systems, or sophisticated portfolio management tools.
To get the most out of this guide, explore the following resources first:
The Iron Butterfly Explained
The iron butterfly is a defined-risk options strategy that aims to profit from minimal price movement in the underlying asset. It consists of four options legs with the same expiration date, all centered around the at-the-money (ATM) strike price.
Mechanics of an Iron Butterfly
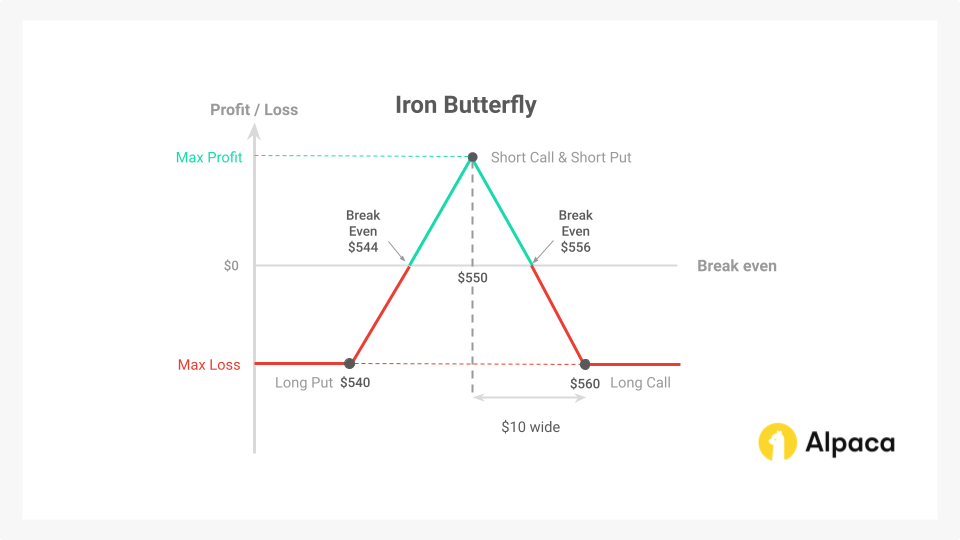
The strategy involves selling one ATM call with strike price KC1, selling one ATM put with strike price KP1, buying one out-of-the-money (OTM) call at strike price KC2, and buying one OTM put at strike price KP2. This configuration, where KP2 < KC1 = S = KP1 < KC2, is typically symmetrical around the current stock price.
In contrast to the iron condor, where short strikes are OTM, the iron butterfly's short strikes converge ATM, resulting in a narrower profit range but a higher initial credit.
Profit/Loss Scenarios
Below is a hypothetical profit/loss (P/L) scenario for an iron butterfly strategy. This scenario uses simplified and rounded numbers for illustrative purposes only. Actual market conditions, implied volatility, and option pricing models will affect the real-world premiums and outcomes.
Assumptions:
- Underlying Asset Price (S): $550.00
- Days to Expiration (DTE): 0 (expiration today)
- Spread Width: $10.00 on each side (the difference between the short strike and the long options)
To set up the iron butterfly position, you could buy and sell the following options at different strike prices with 0DTE. This leads to a tent-shaped profit profile centered on the ATM strike, like the diagram above.
The total option premium collected in this scenario is $11.00 for shorting the $550 strike price put and the $550 strike price call. While the total premium paid is $5.00 for longing the $560 call and $540 put. The net premium collected is then $6.00 since you will collect $11.00 for the short options and pay $5.00 for the long options. Note: We do not consider transaction fees (brokerage fees, commissions, etc) here.
Therefore, in this scenario, profit, loss, and breakeven points would be the following:
- Maximum profit:
- $600.00 (This represents the total premium collected when entering the position, which is $6.00 per share, multiplied by the 100 shares in the contract.)
- Maximum loss:
- $400.00 (This is calculated by taking the difference between the strike prices of the long and short options, which is $10.00 in this example, and subtracting the initial credit of $6.00. This results in a maximum loss of $4.00 per share, or $400.00 for the entire contract of 100 shares).
- The upper breakeven point:
- $544.00 (This is calculated by subtracting the initial credit received ($6.00) from the short put strike price ($550.00))
- The lower breakeven point:
- $556.00 (This is calculated by adding the initial credit received ($6.00) to the short call strike price ($550.00))
The Greeks Impact
An iron butterfly, when thinking about the option Greeks, would be considered a delta-neutral, long-theta, short-vega, and short-gamma strategy.
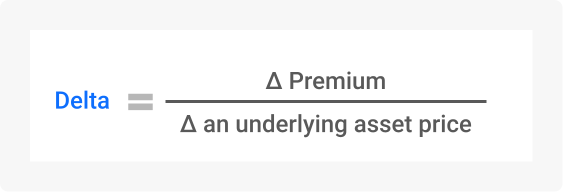
Delta (Δ)
At initiation, delta is near zero (delta neutral) because the short call and put are ATM. As the underlying stock price often deviates from the ATM strike, delta increases, introducing directional risk.
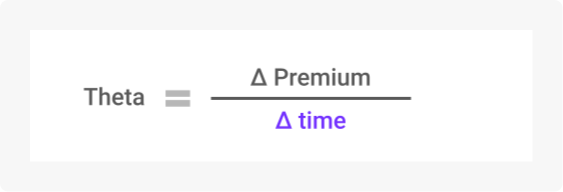
Theta (Θ)
Iron butterflies have significant theta decay, also referred to as long theta, because the ATM options carry higher premiums. Maximum profit occurs when the underlying asset’s price remains near the strike price.
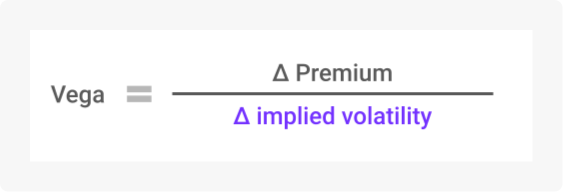
Vega (V)
Higher sensitivity to IV changes since the short ATM options have the most vega. A rise in IV can hurt the position early on, while a drop in IV may be more beneficial. Hence, traders may favor "short vega," where lower volatility enhances profitability.
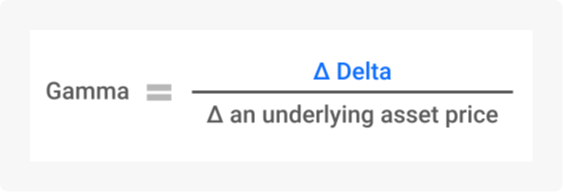
Gamma (Γ):
Gamma risk increases as expiration approaches, especially if the underlying price moves close to a short strike. This makes active risk management crucial. Large moves in the underlying asset may lead to losses as the short options gain intrinsic value. Iron butterflies are "short gamma," meaning the strategy is negatively impacted by significant price movements.
Algorithmic Trading and Risk Management Considerations
The iron butterfly strategy offers a unique approach to capitalizing on low-volatility environments. However, its success hinges on precise execution and risk management. To effectively implement this strategy algorithmically, traders should consider the following factors:
Entry and Exit Strategies
Establishing clear entry and exit rules helps maximize profitability and manage risk in a structured manner.
- Range-Bound Identification: Utilize technical indicators like Bollinger Bands and RSI (e.g., 30-50), coupled with volatility metrics (IV percentile), to identify periods of low volatility and elevated implied volatility.
- Identify Entry Conditions: Identify low-volatility periods with IV percentiles exceeding a predefined threshold (e.g., 30-40%) to maximize premium capture. Construct a symmetric butterfly spread with short strikes centered ATM and long wings spaced 5 points apart to maintain delta neutrality. Ensure net delta neutrality at entry within a specified tolerance (e.g., ±0.05).
- Profit Target and Stop-Loss: Establish clear exit criteria, such as a predefined profit target (e.g., 50% of credit received) or a stop-loss threshold (e.g., $500 loss) to protect against adverse market movements.
Mitigating Risks in Trending Markets
To mitigate the risks associated with directional moves in the underlying asset, several strategies can be employed:
- Directional Risk Management: Monitor and manage directional risk by adjusting the position's delta as the underlying stock’s price moves.
- Gamma Risk Control: As expiration approaches, gamma sensitivity increases, potentially leading to significant profit and loss (P&L) swings. Employ rolling strategies to reduce gamma exposure and mitigate this risk.
- Volatility Impact: Carefully monitor volatility trends and adjust the strategy accordingly. High volatility may erode profitability, while low volatility may enhance returns.
Backtesting and Optimization
Backtesting is essential to evaluate the effectiveness of the strategy under different historical market conditions.
- Historical Performance: Backtest the strategy in historical low-volatility periods to assess its historical performance and identify optimal parameter settings.
- Robust Risk Management: Test stop-loss mechanisms under various market conditions, including high-volatility scenarios, to ensure effective risk containment.
- Parameter Optimization: Experiment with different strike distances and credit-to-risk ratios to fine-tune the strategy's risk-reward profile.
Risk Management and Sensitivity Analysis
Effective risk management measures are critical to ensure portfolio stability and limit potential losses.
- Gamma and Vega Sensitivity: Be mindful of gamma and vega risks, which can amplify P/L swings during periods of high volatility or rapid price movements.
- Position Sizing: Implement position sizing techniques to limit exposure to a specific percentage of the overall portfolio (e.g., 1-2%) to control risk.
- Delta Hedging: Employ delta hedging strategies to neutralize directional risk and stabilize the position's P&L.
The Iron Condor Explained
An iron condor is a defined-risk options strategy that profits from the underlying asset's price remaining within a specific range. It involves selling an OTM call and an OTM put, while simultaneously buying further OTM call and put options to limit potential losses.
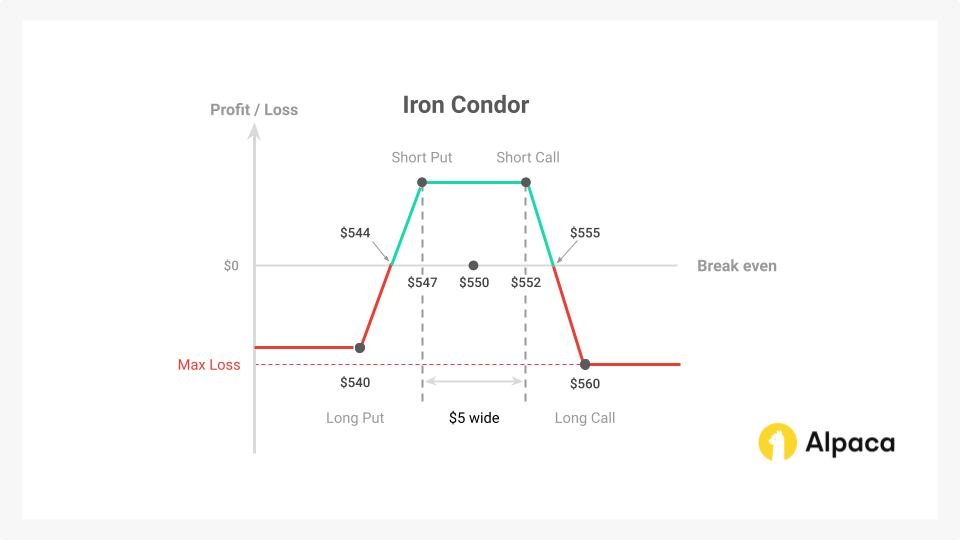
Mechanics of an Iron Condor
Structurally, the iron condor involves selling one OTM call with the strike price KC1, buying one OTM call at strike price KC2, selling one OTM put at strike price KP1, and buying one OTM put at strike price KP2. If the current stock price is denoted as S, the strikes satisfy the following relationship: KP2 < KP1 < S < KC1 < KC2.
The distance between the short and long strikes on each side defines the "wings" of the condor, which cap both the maximum profit and loss. The payoff diagram at expiration, shown above, resembles a plateau with sloping sides, reflecting the profit zone within the defined range and the limited losses beyond the wings. The purchased OTM options act as protective "wings," ensuring that losses are capped if the underlying asset price moves significantly beyond the expected range.
Profit/Loss Scenarios
To solidify the understanding of iron condor, let's consider a hypothetical P/L scenario of the strategy. Please note that the values used here are for illustrative purposes only and do not represent actual market conditions.
Assumptions:
- Underlying Asset Price (S): $550.00
- Days to Expiration (DTE): 0 (Expiration Today)
- Spread Width: $5.00 for both put and call spreads.
To set up the iron condor position, you could buy and sell the following options at different strike prices:
The total option premium collected in this scenario is $3.35 for shorting the $552 strike price put and the $547 strike price call. While the total premium paid is $0.35 for longing the $560 call and $540 put. The net premium collected is then $3.00 since you will collect $3.35 for the short options and pay $0.35 for the long options. Note: We do not consider transaction fees (brokerage fees, commissions, etc.) here.
Therefore, in this scenario, maximum profit, loss, and breakeven points would be the following:
- Maximum profit:
- $300.00 (This represents the total premium collected when entering the position, which is $3.00 per share, multiplied by the 100 shares in the contract.)
- Maximum loss:
- $500.00 (This is calculated by taking the width of the wider spread ($8.00 in this example) and subtracting the initial credit of $3.00. This results in a maximum loss of $5.00 per share, or $500.00 for the entire contract of 100 shares.)
- The upper breakeven point:
- $555.00 (This value is determined by adding the initial credit received ($3.00) to the short call strike price ($552.00).)
- The lower breakeven point:
- $544.00 (This value is determined by subtracting the initial credit received ($3.00) from the short put strike price ($547.00).)
Greeks
Just like the iron butterfly strategy, an iron condor is also delta-neutral, long-theta, short-vega, and short-gamma strategy.
Delta (Δ)
At initiation, the net delta of an iron condor is near zero because the short call and short put are both OTM. However, as the underlying security price moves, delta shifts, increasing directional risk if the price approaches one of the short strikes.
Traders typically aim for a delta-neutral position, meaning the net delta remains close to zero, so the overall value of the strategy is less affected by small changes in the underlying asset's price. As the underlying stock’s price often deviates, delta in an iron condor scenario is restrained from growing as quickly as it does in an iron butterfly.
Theta (Θ)
Iron condors benefit from time decay because the short options lose extrinsic value faster than the long "wings". A stable underlying stock price maximizes theta gains, making "long theta" a desirable characteristic for this strategy.
Vega (V)
An increase in IV inflates option premiums, potentially reducing the strategy's mark-to-market profit. Conversely, falling IV reduces premium values, benefiting the position. Traders favor "short vega," where lower volatility enhances profitability.
Gamma (Γ)
Iron condors have lower gamma than that of iron butterfly, meaning it is less vulnerable to significant price moves, but gamma risk rises as expiration approaches–especially if the underlying asset price nears a short strike. This may necessitate adjustments to manage risk.
Algorithmic Trading and Risk Management Considerations
The iron condor strategy combines a bull put spread and a bear call spread, making it a versatile tool for capturing premium in range-bound markets. Below are key considerations for algorithmic implementation, incorporating detailed entry and exit mechanics.
Entry and Exit Strategies
Establishing clear entry and exit rules helps maximize profitability and manage risk in a structured manner.
- Range-Bound Identification: Utilize technical indicators like Bollinger Bands and RSI, coupled with volatility metrics (IV percentile), to identify periods of low volatility and elevated implied volatility.
- Strike Selection: Employ statistical techniques to select strikes that optimize profit potential while managing risk. Factors like historical volatility and implied volatility can guide this process.
- Profit Targets and Stop-Loss: Implement clear profit targets (e.g., 50% of credit received) and stop-loss orders (e.g., max loss equals spread width minus credit) to automate position management.
Dynamic Adjustments
Dynamic adjustments allow traders to respond effectively to changing market conditions and optimize profitability.
- Rolling Strategies: Implement algorithms to automatically roll the untested side of the spread to lock in profits or reduce risk as the underlying asset price moves.
- Volatility Adjustments: Monitor implied volatility and adjust the position size or strike width to adapt to changing market conditions.
- Risk Management: Employ rigorous risk management techniques, including position sizing, stop-loss orders, and hedging strategies, to mitigate potential losses.
Backtesting and Optimization
Backtesting is essential to evaluate the effectiveness of the strategy under different historical market conditions.
- Historical Testing: Conduct extensive backtesting across various market regimes to assess the strategy's historical performance and identify optimal parameter settings.
- Sensitivity Analysis: Analyze the impact of different variables, such as strike selection, expiration dates, and volatility levels, on the strategy's profitability.
- Strike Placement Optimization: Experiment with different strike placement techniques (e.g., one standard deviation OTM vs. fixed percentage distances) to fine-tune risk-reward profiles.
- Time Decay Analysis: Evaluate the impact of time decay by comparing short-term (7-10 days) and long-term (30+ days) expiration strategies.
- Volatility Dynamics: Analyze how historical volatility changes influence profitability, focusing on high-volatility entry and low-volatility exit scenarios.
Risk Management
Effective risk management measures may help to ensure portfolio stability and limit potential losses.
- Loss Limitation: Implement stop-loss orders to cap potential losses when the underlying stock price breaches predefined risk thresholds.
- Portfolio Protection: Consider using position sizing algorithms to ensure no single trade exceeds a specified percentage (e.g., 1-2%) of the overall portfolio equity.
- Hedging Strategies: Examine hedging directional risk with delta-neutral adjustments, such as adding offsetting futures or stock positions.
Iron Butterfly vs. Iron Condor: A Comparative Analysis
The iron butterfly and iron condor are both volatility-based strategies, but they differ in their structure and risk profiles.
An iron butterfly involves selling an ATM straddle and buying OTM strangles. This strategy offers a higher potential profit, particularly in low-volatility environments. However, it is more sensitive to volatility changes and requires precise timing and risk management.
An iron condor combines a bear call spread and a bull put spread, creating a defined risk profile with a wider potential profit zone. This strategy is ideal for range-bound markets and is less sensitive to volatility changes.
While the iron butterfly generally has a higher potential profit due to its ATM option positions, the iron condor often offers a more consistent and predictable payoff profile.
Risk/Reward Profile
The iron condor typically offers a wider profit range but a smaller initial credit. The iron butterfly, in contrast, provides a larger initial credit and thus a higher potential profit if the underlying asset remains pinpointed near the short strikes. However, the narrower profit region of the iron butterfly means it can lose money more easily if the stock strays from the center strike price.
Market Suitability
The iron butterfly strategy excels in environments with extremely low implied volatility and when the underlying asset's price is expected to remain relatively stable near a specific level. However, it's important to note that this strategy is highly sensitive to price movements. Any significant deviations from the center strike price can quickly erode the position's profitability.
The iron condor strategy is well-suited for range-bound markets, where the underlying asset's price is expected to stay within a defined range. Additionally, it can tolerate moderate price fluctuations compared to the iron butterfly due to its wider "wings" (the distance between the short and long options). This wider range provides a larger buffer against losses if the underlying asset's price moves unexpectedly.
Algorithmic Trading Applications
Iron Butterfly:
- Low-Volatility Periods: Better suited for periods of low implied volatility, such as during earnings seasons when the market anticipates minimal price movement.
- Post-Catalyst Events: Can be employed after significant news events or catalysts that are expected to lead to a decline in implied volatility.
Iron Condor:
- Mean Reversion Strategies: Pair well with algorithms that identify mean-reverting price movements, such as those based on Bollinger Band compressions or other statistical indicators.
- Low-Volatility Environments: Can be effectively implemented in low-volatility markets where the underlying asset is expected to remain within a defined range.
Conclusion
Iron condors and iron butterflies are volatility-based strategies that capitalize on time decay. While both offer defined risk profiles, they differ in their risk-reward dynamics and sensitivity to market conditions.
Iron butterflies may offer higher potential returns, especially in low-volatility environments, but their narrower profit zone and higher sensitivity to volatility demand precise timing and risk management. Iron condors are more resilient to minor price fluctuations due to their wider profit zone but typically generate lower credit.
For algorithmic traders, understanding these nuances is crucial. Rigorous backtesting, robust risk management, and continuous monitoring are essential to optimize strategy selection, parameterization, and performance. By incorporating advanced techniques like delta-neutral hedging and volatility targeting, traders can enhance risk management and capitalize on market opportunities to generate consistent profits.
Curious about options? Read more about options strategies and trading and learn how to trade options using Alpaca’s Trading API.
Options trading is not suitable for all investors due to its inherent high risk, which can potentially result in significant losses. Please read Characteristics and Risks of Standardized Options before investing in options.
Past hypothetical backtest results do not guarantee future returns, and actual results may vary from the analysis.
The Paper Trading API is offered by AlpacaDB, Inc. and does not require real money or permit a user to transact in real securities in the market. Providing use of the Paper Trading API is not an offer or solicitation to buy or sell securities, securities derivative or futures products of any kind, or any type of trading or investment advice, recommendation or strategy, given or in any manner endorsed by AlpacaDB, Inc. or any AlpacaDB, Inc. affiliate and the information made available through the Paper Trading API is not an offer or solicitation of any kind in any jurisdiction where AlpacaDB, Inc. or any AlpacaDB, Inc. affiliate (collectively, “Alpaca”) is not authorized to do business.
Please note that this article is for general informational purposes only and is believed to be accurate as of the posting date but may be subject to change. The examples above are for illustrative purposes only. Alpaca does not provide investment, tax, or legal advice. Please consult your own independent advisor as to any investment, tax, or legal statements made herein.
All investments involve risk, and the past performance of a security, or financial product does not guarantee future results or returns. There is no guarantee that any investment strategy will achieve its objectives. Please note that diversification does not ensure a profit, or protect against loss. There is always the potential of losing money when you invest in securities, or other financial products. Investors should consider their investment objectives and risks carefully before investing.
Securities brokerage services are provided by Alpaca Securities LLC ("Alpaca Securities"), member FINRA/SIPC, a wholly-owned subsidiary of AlpacaDB, Inc. Technology and services are offered by AlpacaDB, Inc.
This is not an offer, solicitation of an offer, or advice to buy or sell securities or open a brokerage account in any jurisdiction where Alpaca Securities are not registered or licensed, as applicable.

